Introduction
VMware is a virtualization and cloud computing software that distributes the work of a given virtual server across multiple physical hosts.
VMware also enables each physical host to run multiple virtual server instances.
OpsRamp collects inventory and performance data using the following methods:
- Uses SOAP APIs to access vCenter and ESXi hosts
- Connects via SSH to monitor appliances
- Retrieves host hardware data through CIM APIs
- Gathers vSAN inventory and metrics using Python APIs
- Uses REST APIs to collect VxRail inventory and performance data
Note
OpsRamp’s Gateway based VMware discovery is used to halt vCenter discovery if any host was in a maintenance or disconnected state up to gateway version 14.1.0.
From 14.2.0 gateway version onwards we have improved the process so that vCenter discovery can proceed even if a host is in a maintenance or disconnected state.
Only the following child resources of a host in maintenance or disconnected state will not be updated, while the rest of the vCenter components will be updated without any impact.
- VMs
- DataStores
- OOBInterfaceDetails
- VxRail components (Boot info and PhysicalDisks)
- vSAN components (HardDisks)
Supported Target Versions
- VMware vCenter 6.0.0, 6.5.0, 7.0.0, 8.0.0, 8.0.0 U2, 8.0.0 U3, 9.0.0, and VMware ESXi 8.0.3 U D and 9.0.0.
Note
OpsRamp’s VMware integration metrics are not uniformly supported across all VMware versions. Metric availability and applicability depend on the specific VMware platform version in use.
For example, CIM-based monitoring is not supported on vCenter Server 9.0.0 and later, as VMware has deprecated CIM support in these versions.
Additionally, vSAN, VxRail, and RPv4 VM monitoring have not been certified against vCenter 9.x due to the unavailability of a test environment.
See VMware Recommended templates for more details.
Prerequisites
Ensure that the end device (vCenter or ESXi host) is reachable from the OpsRamp gateway. Use the following command to verify connectivity:
ping <device IP address>Classic Gateway
Allow inbound and outbound traffic between the OpsRamp gateway and the vCenter or ESXi host server APIs (REST, SOAP, Python, etc.) on the respective port.
The default port is 443.
To verify connectivity, use:telnet <device IP address> <port>
Allow inbound and outbound traffic between the OpsRamp gateway and the vCenter or ESXi CIM interface for CIM-based monitoring.
The default port is 5989.NextGen Gateway
Allow inbound and outbound traffic between nodes or load balancers and the vCenter or ESXi APIs (such as REST, SOAP, or Python-based interfaces).
The default port is 443.
Allow inbound and outbound traffic on the CIM monitoring port (default: 5989) between nodes/load balancers and the vCenter or ESXi CIM interfaces for hardware-level monitoring.
The default port is 5989.Inventory and performance monitoring
To enable inventory and performance monitoring, create a vCenter user with at least the Read-only role. Make sure to select the “Propagate to children” checkbox when assigning the role.
Follow the below steps to create a vCenter user with the required permissions for discovery and performance monitoring.
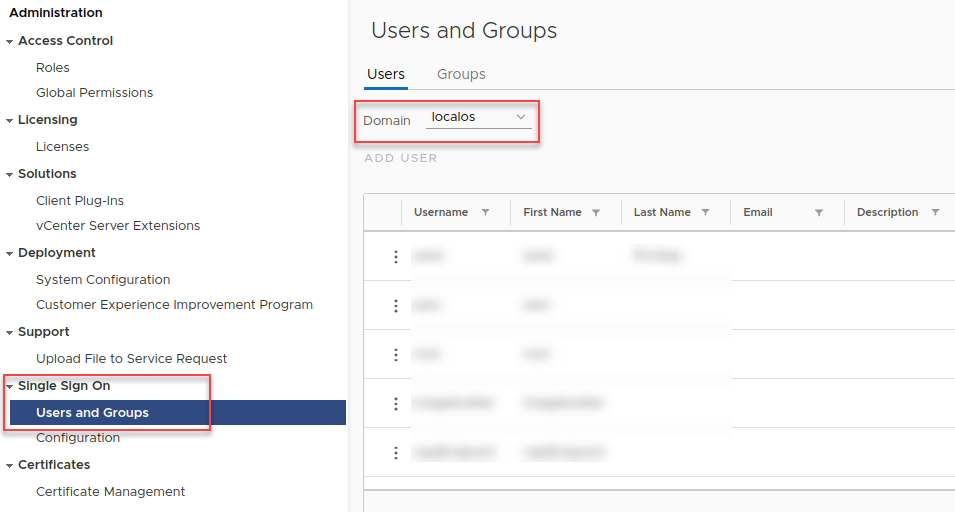
- Under Single Sign On, click Users and Groups.
- Select the required domain from the Domain list box and click Add User.
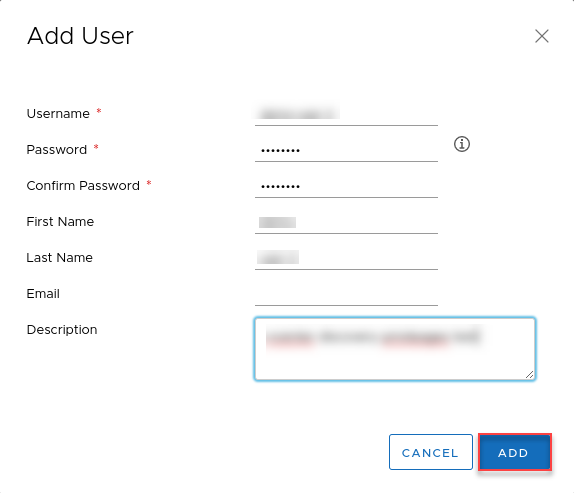
- Enter the required details and click Add.
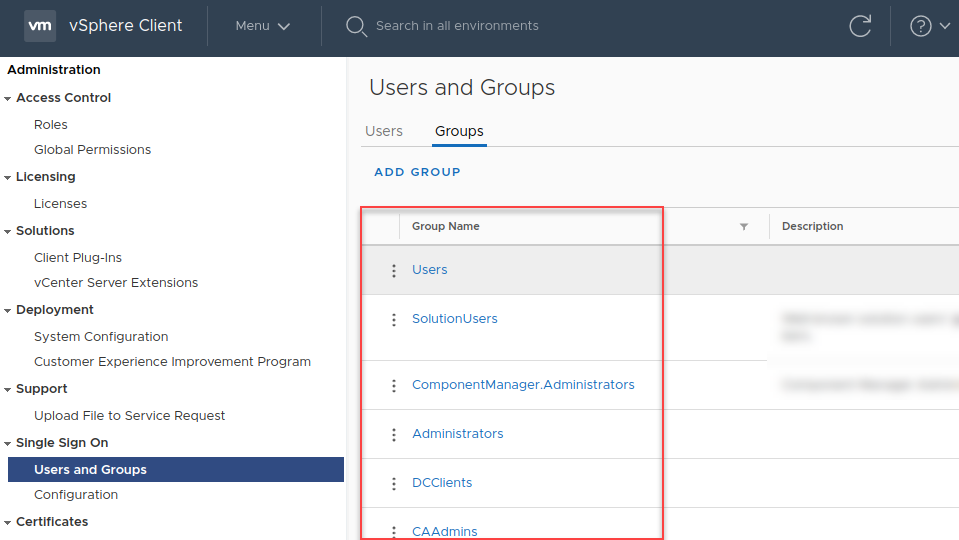
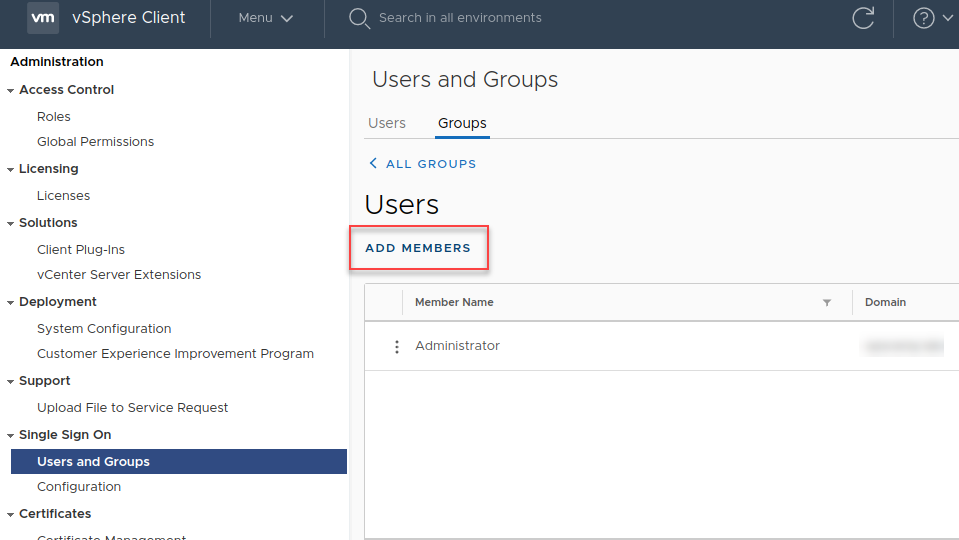
- Under Groups, select a group from the Group Name and add members by clicking ADD MEMBERS.
Note: Click ADD GROUP to add a new group.
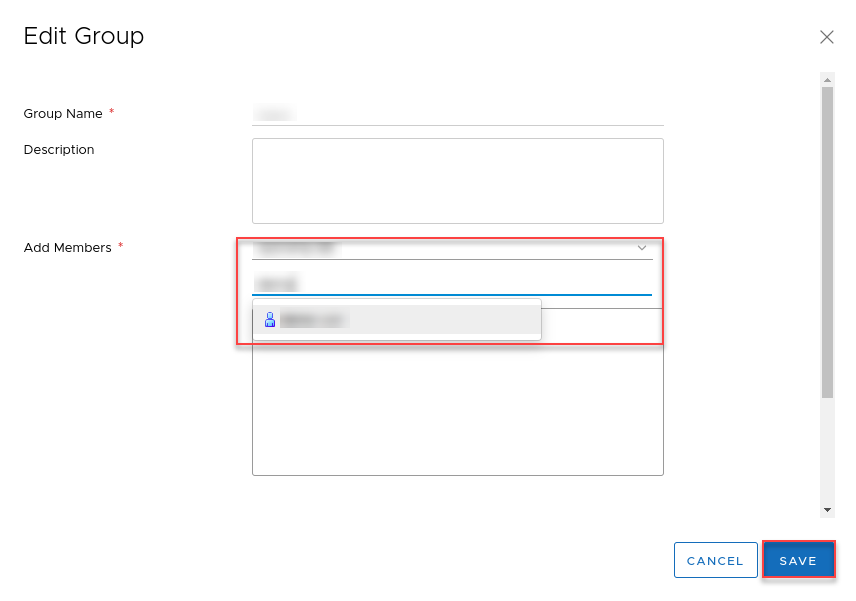
- Search for the user in the Add Member and click SAVE.
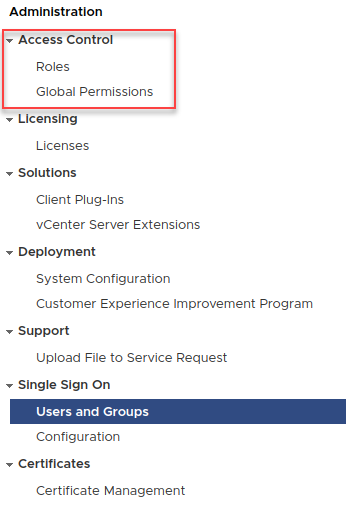
- Under Access Control, click Global Permissions.
- Select the user and click +.
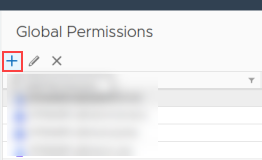
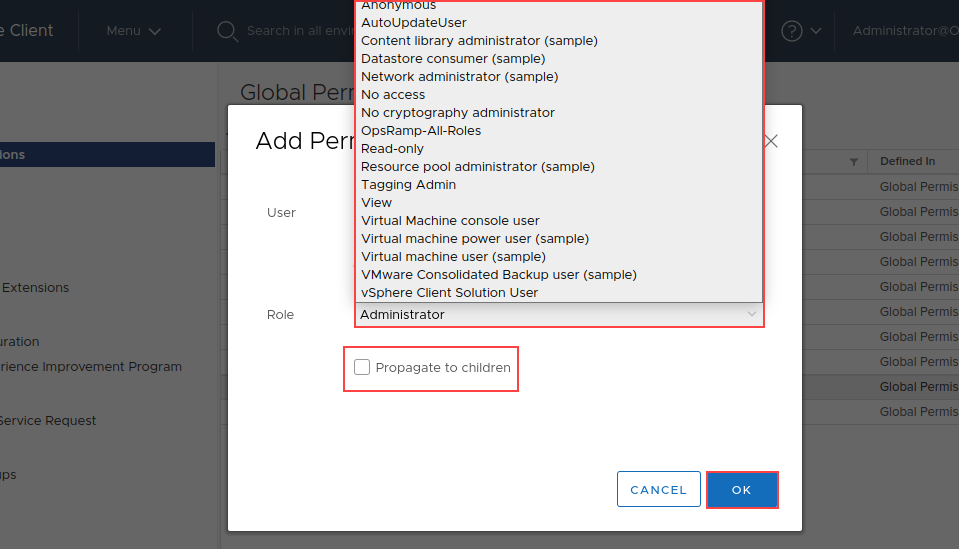
- Search for the user and select the role from the Role list.
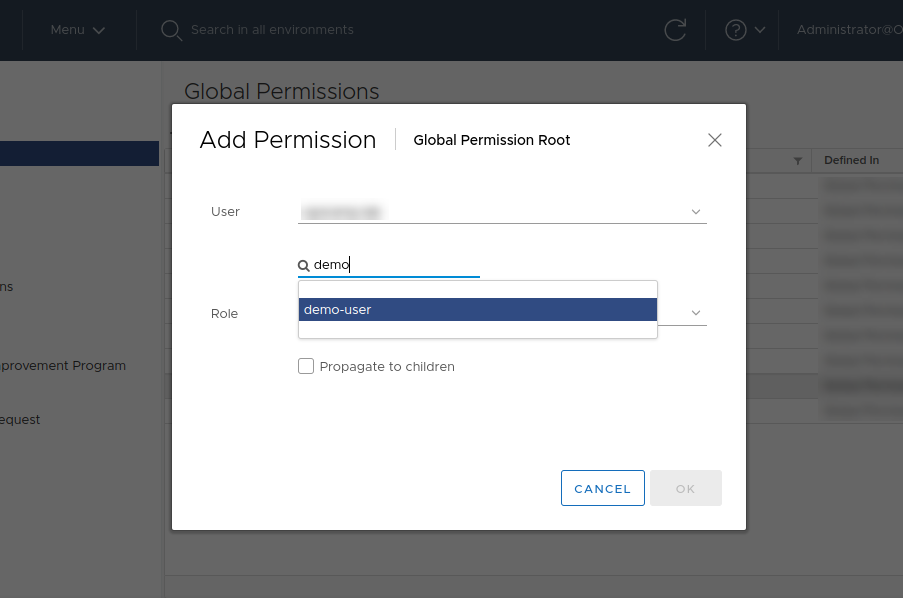
- Select Propagate to children checkbox and click OK.
Note: Username of the vCenter is
<name of the user>@<domain name>
vCenter appliance monitoring
Apply SSH credentials to the vCenter server.
Users must have the appropriate privilege to execute commands on the vCenter appliance command prompt. For example, the privilege to execute commands such as
shellandhelp api list.Steps to create SSH user for appliance monitoring.
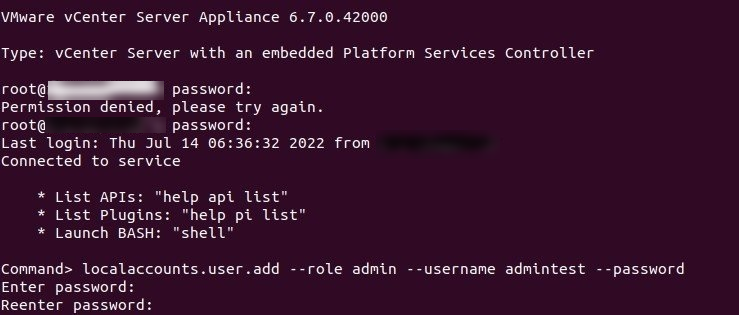
Once a user with the super administrator role successfully logged into vCenter using ssh.
Note: The default user with a super administrator role is root.Create a local user account for the vCenter appliance, i.e., admin or super admin using the command
localaccounts.user.add --role (admin/superadmin) --username(test) --password,.
Example:localaccounts.user.add --role admin --username TestUser --passwordWhen prompted, enter and verify the new local user’s password.
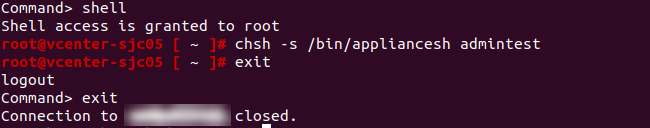
- To switch to bash shell from appliance-shell.
Command>shell
Note: if the above command does not work, we recomment usingCommand>bash
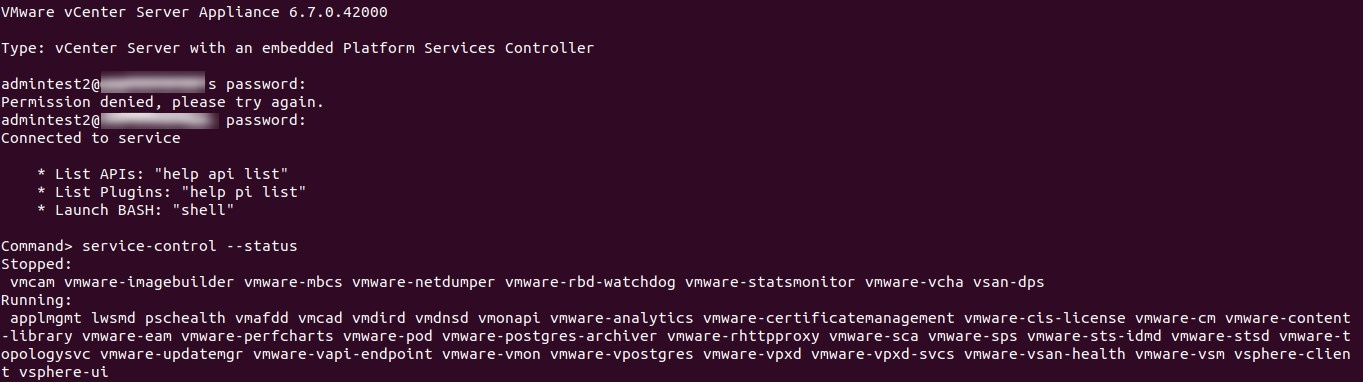
To set appliance shell as the default shell run below command in the vCenter.chsh -s /bin/appliancesh <Opsramp-SSH-username> - Exit the shell first, then the vCenter appliance.
- Login to the created new user role with ssh and we can execute the command
service-control --statuswill work in the new user role directly.
See Create a Local User Account in the vCenter Server Appliance and Enable Access to the VCSA Bash shell or Appliance Shell for more information.
Host hardware monitoring through CIM
Enable CIM APIs on each ESXi server, open port 5989 for communication, and apply the “VMware ESXi Hardware Status” template for monitoring.
You can retrieve ESXi host hardware data using either a vCenter user or an ESXi host user. To retrieve data using a vCenter user, follow these steps:
The user accounts configured for VMware integration must have privileges to access CIM APIs. Configure CIM and CIM Interaction permissions to access the host hardware metrics. Refer to Host CIM Privileges in the VMware documentation.
From vcenter version 8.0 the CIM monitoring is to be enabled manually using the command esxcli system wbem set -e true by connecting to the respective esxi using ssh credentials as mentioned in the Control Access for CIM-Based Hardware Monitoring Tools in the VMware documentation
Steps to assign CIM permissions to vCenter users.
1. vCenter User should have Host CIM and CIM interaction privileges.
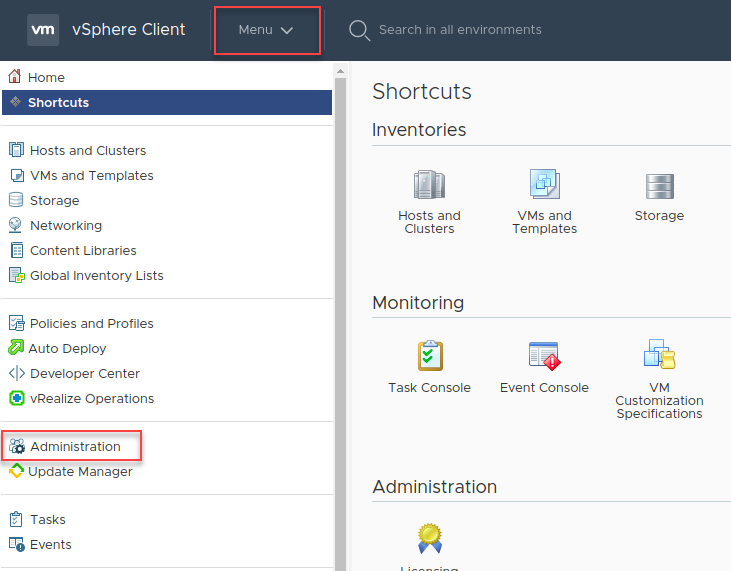
2. Click Menu and then select Administration.
3. In the Administration section, click Roles.
4. Select the role assigned to the user.
5. On the right-hand side of the screen, click Privileges.
6. Check to see if the privileges listed are the ones that should be assigned to the user.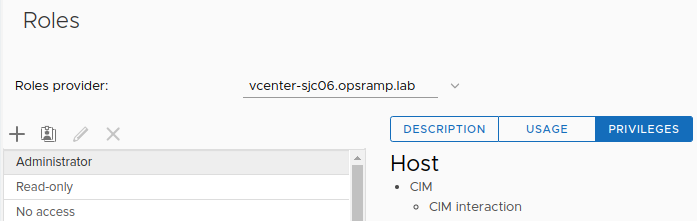
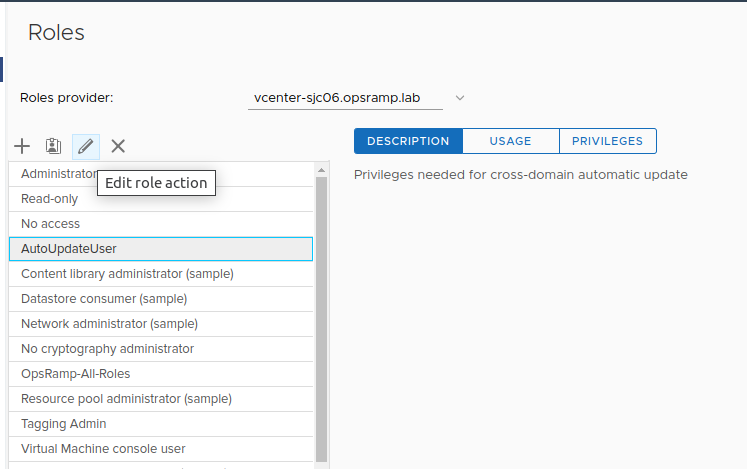
- Alternatively, grant the rights by taking the following actions:
- Click Edit role action and select the provider.
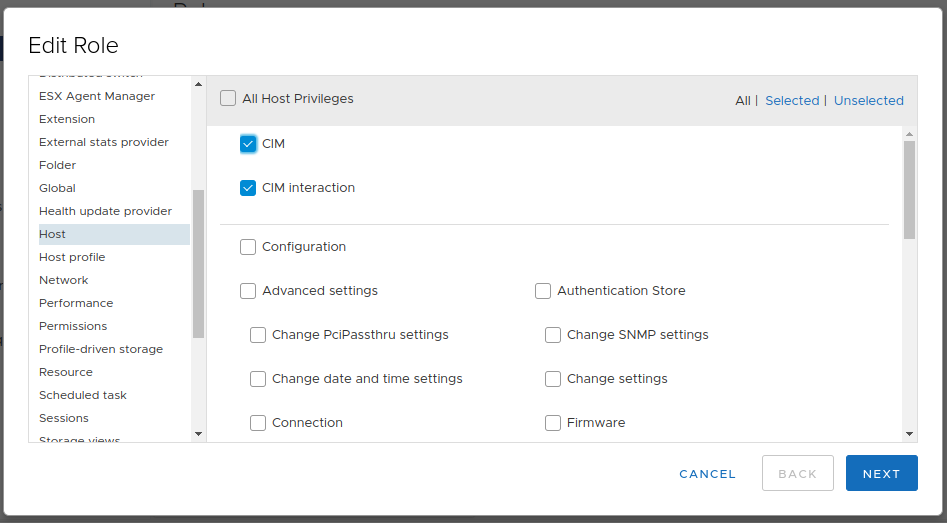
- On the Edit Role page, check box the CIM and CIM interaction.
- Click NEXT.
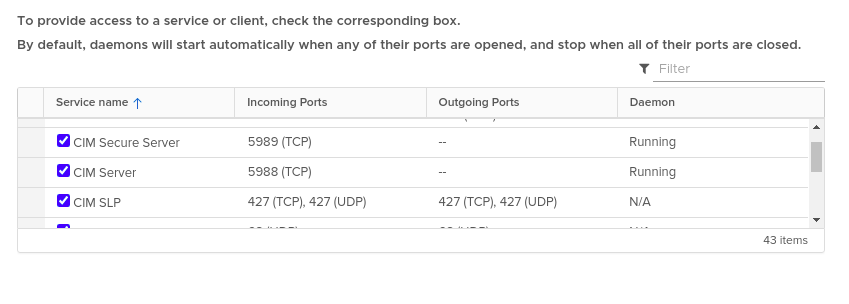
- The VMware Host should have the CIM Service functioning.
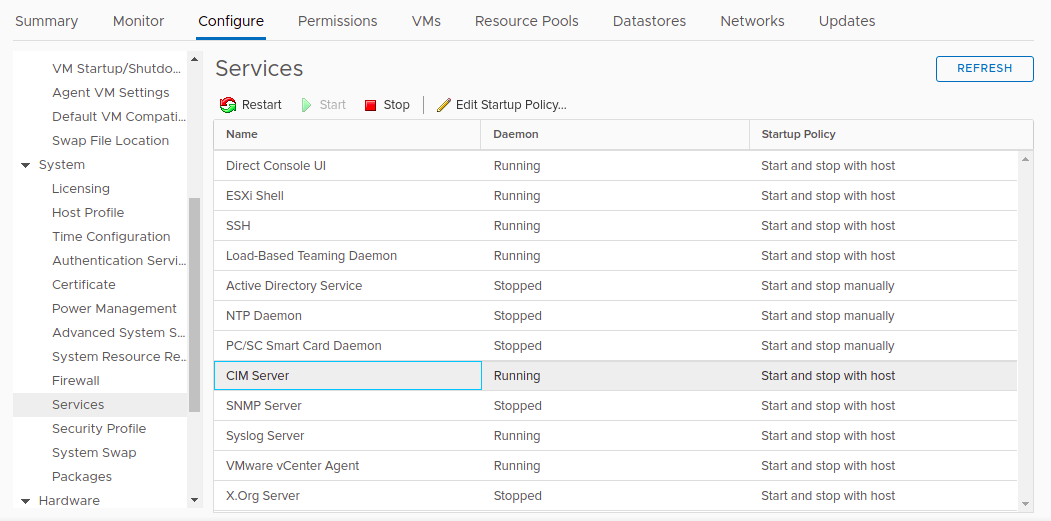
- Enable gateway IPAddress access to
5989,5988port.
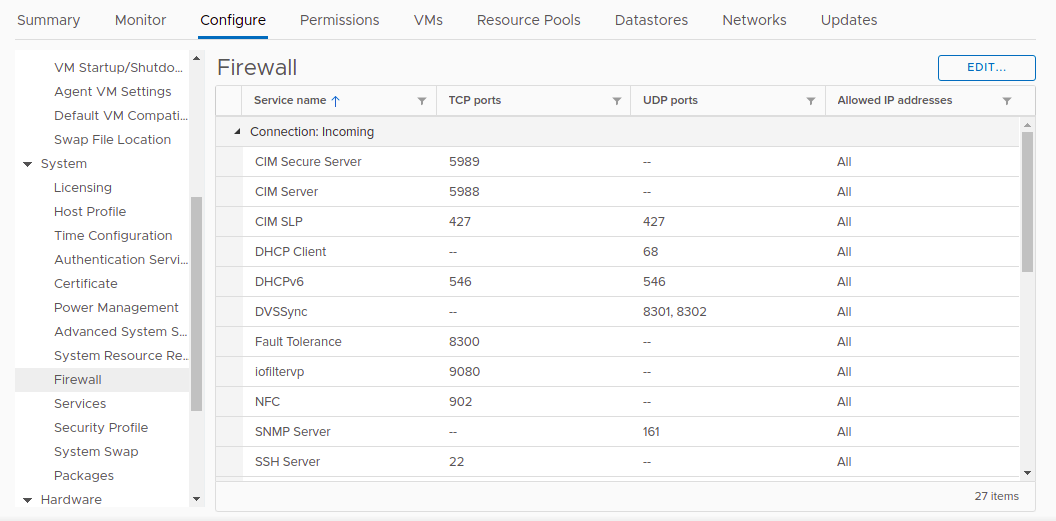
- CIM Secure Server and CIM Server services should be in running state.
- Able to telnet from the gateway to
5989port.
For example:telnet <vmware-host-IP> 5989
Notes:- If you assign CIM privileges to vCenter Account then it will allow you to perform host hardware monitoring or else create and assign.
- CIM credentials on each host Steps to assign CIM permissions to vCenter Account (yet to work).
To retrieve CIM data using an ESXi host user, follow these steps:
Steps to assign CIM permissions to vCenter users.
Note
Admin permission are required for CIM Monitoring to the standalone ESXI host user.- Log in to host. Click Manage –> Users –> Add user.
- Enter the details and click Add.

- Right click on Host and select Permissions.

- Select the required role from the list, check the Propagate to all childre option, and click Assign role to apply permissions across all associated objects.

Steps to create user with CLI commands
Log in to the ESXi host using SSH credential.
Create the user using the following command.
esxcli system account add --id <username> --password <password> --description <description> --role <role>Use the following command to modify the role assigned to a user on host.
esxcli system permission set --id=<username> --role=<roleName>or
vim-cmd vimsvc/auth/entity_permission_add <moid> <username> <isGroup> <role> <propagate>Example: Adding ‘admin’ role to a user of the EXSI host.
esxcli system permission set –id=‘cim’ –role=‘Admin’
vim-cmd vimsvc/auth/entity_permission_add vim.Folder:ha-folder-root cim false Admin trueNote
If you create a custom role without assigning any privileges, vCenter assigns it as a read-only role with three system-defined privileges: **System.Anonymous**, **System.View**, and **System.Read**. These privileges are not visible in the vSphere Client but are required to access certain properties of managed objects. All predefined roles in vCenter Server include these three privileges by default.
For RP4VM monitoring, Dell RecoverPoint for Virtual Machines (RP4VM) should be integrated with vSphere.
Hierarchy of vCentre
Compute
— Compute
— Datacenter
— Cluster
— Host
— Virtual Machine
Storage
— Storage
— Datastore
Install the integration
- From All Clients, select a client.
- Navigate to Setup > Account.
- Select the Integrations and Apps tab.
- The Installed Integrations page, where all the installed applications are displayed. If there are no installed applications, it will navigate to the Available Integrations and Apps page.
- Click + ADD on the Installed Integrations page. The Available Integrations and Apps page displays all the available applications along with the newly created application with the version.
- Search for the application using the search option available. Alternatively, use the All Categories option to search.
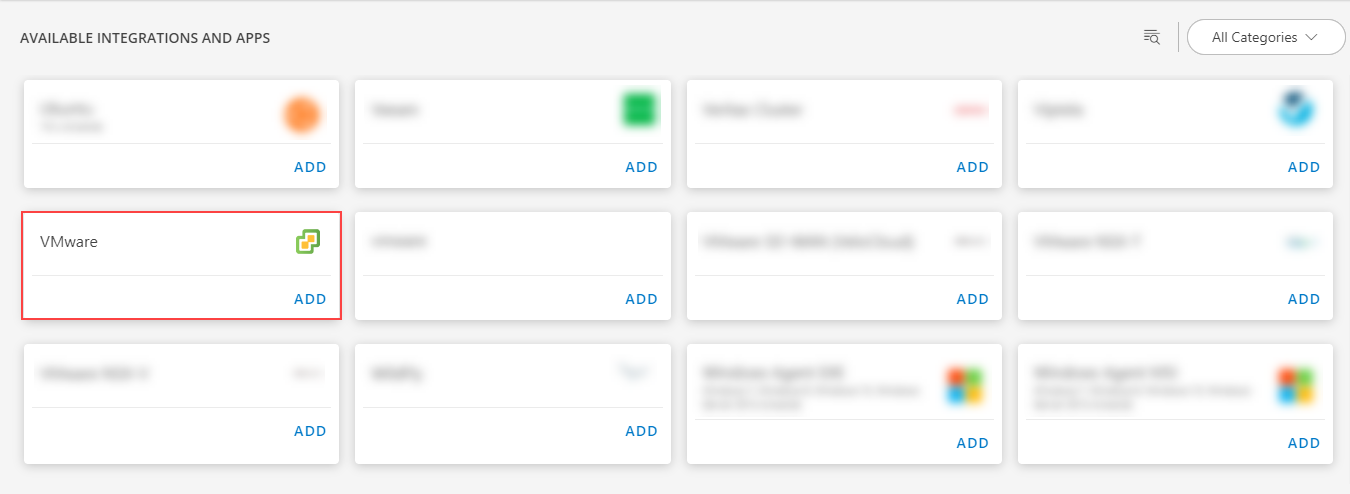
- Click ADD on the VMware.
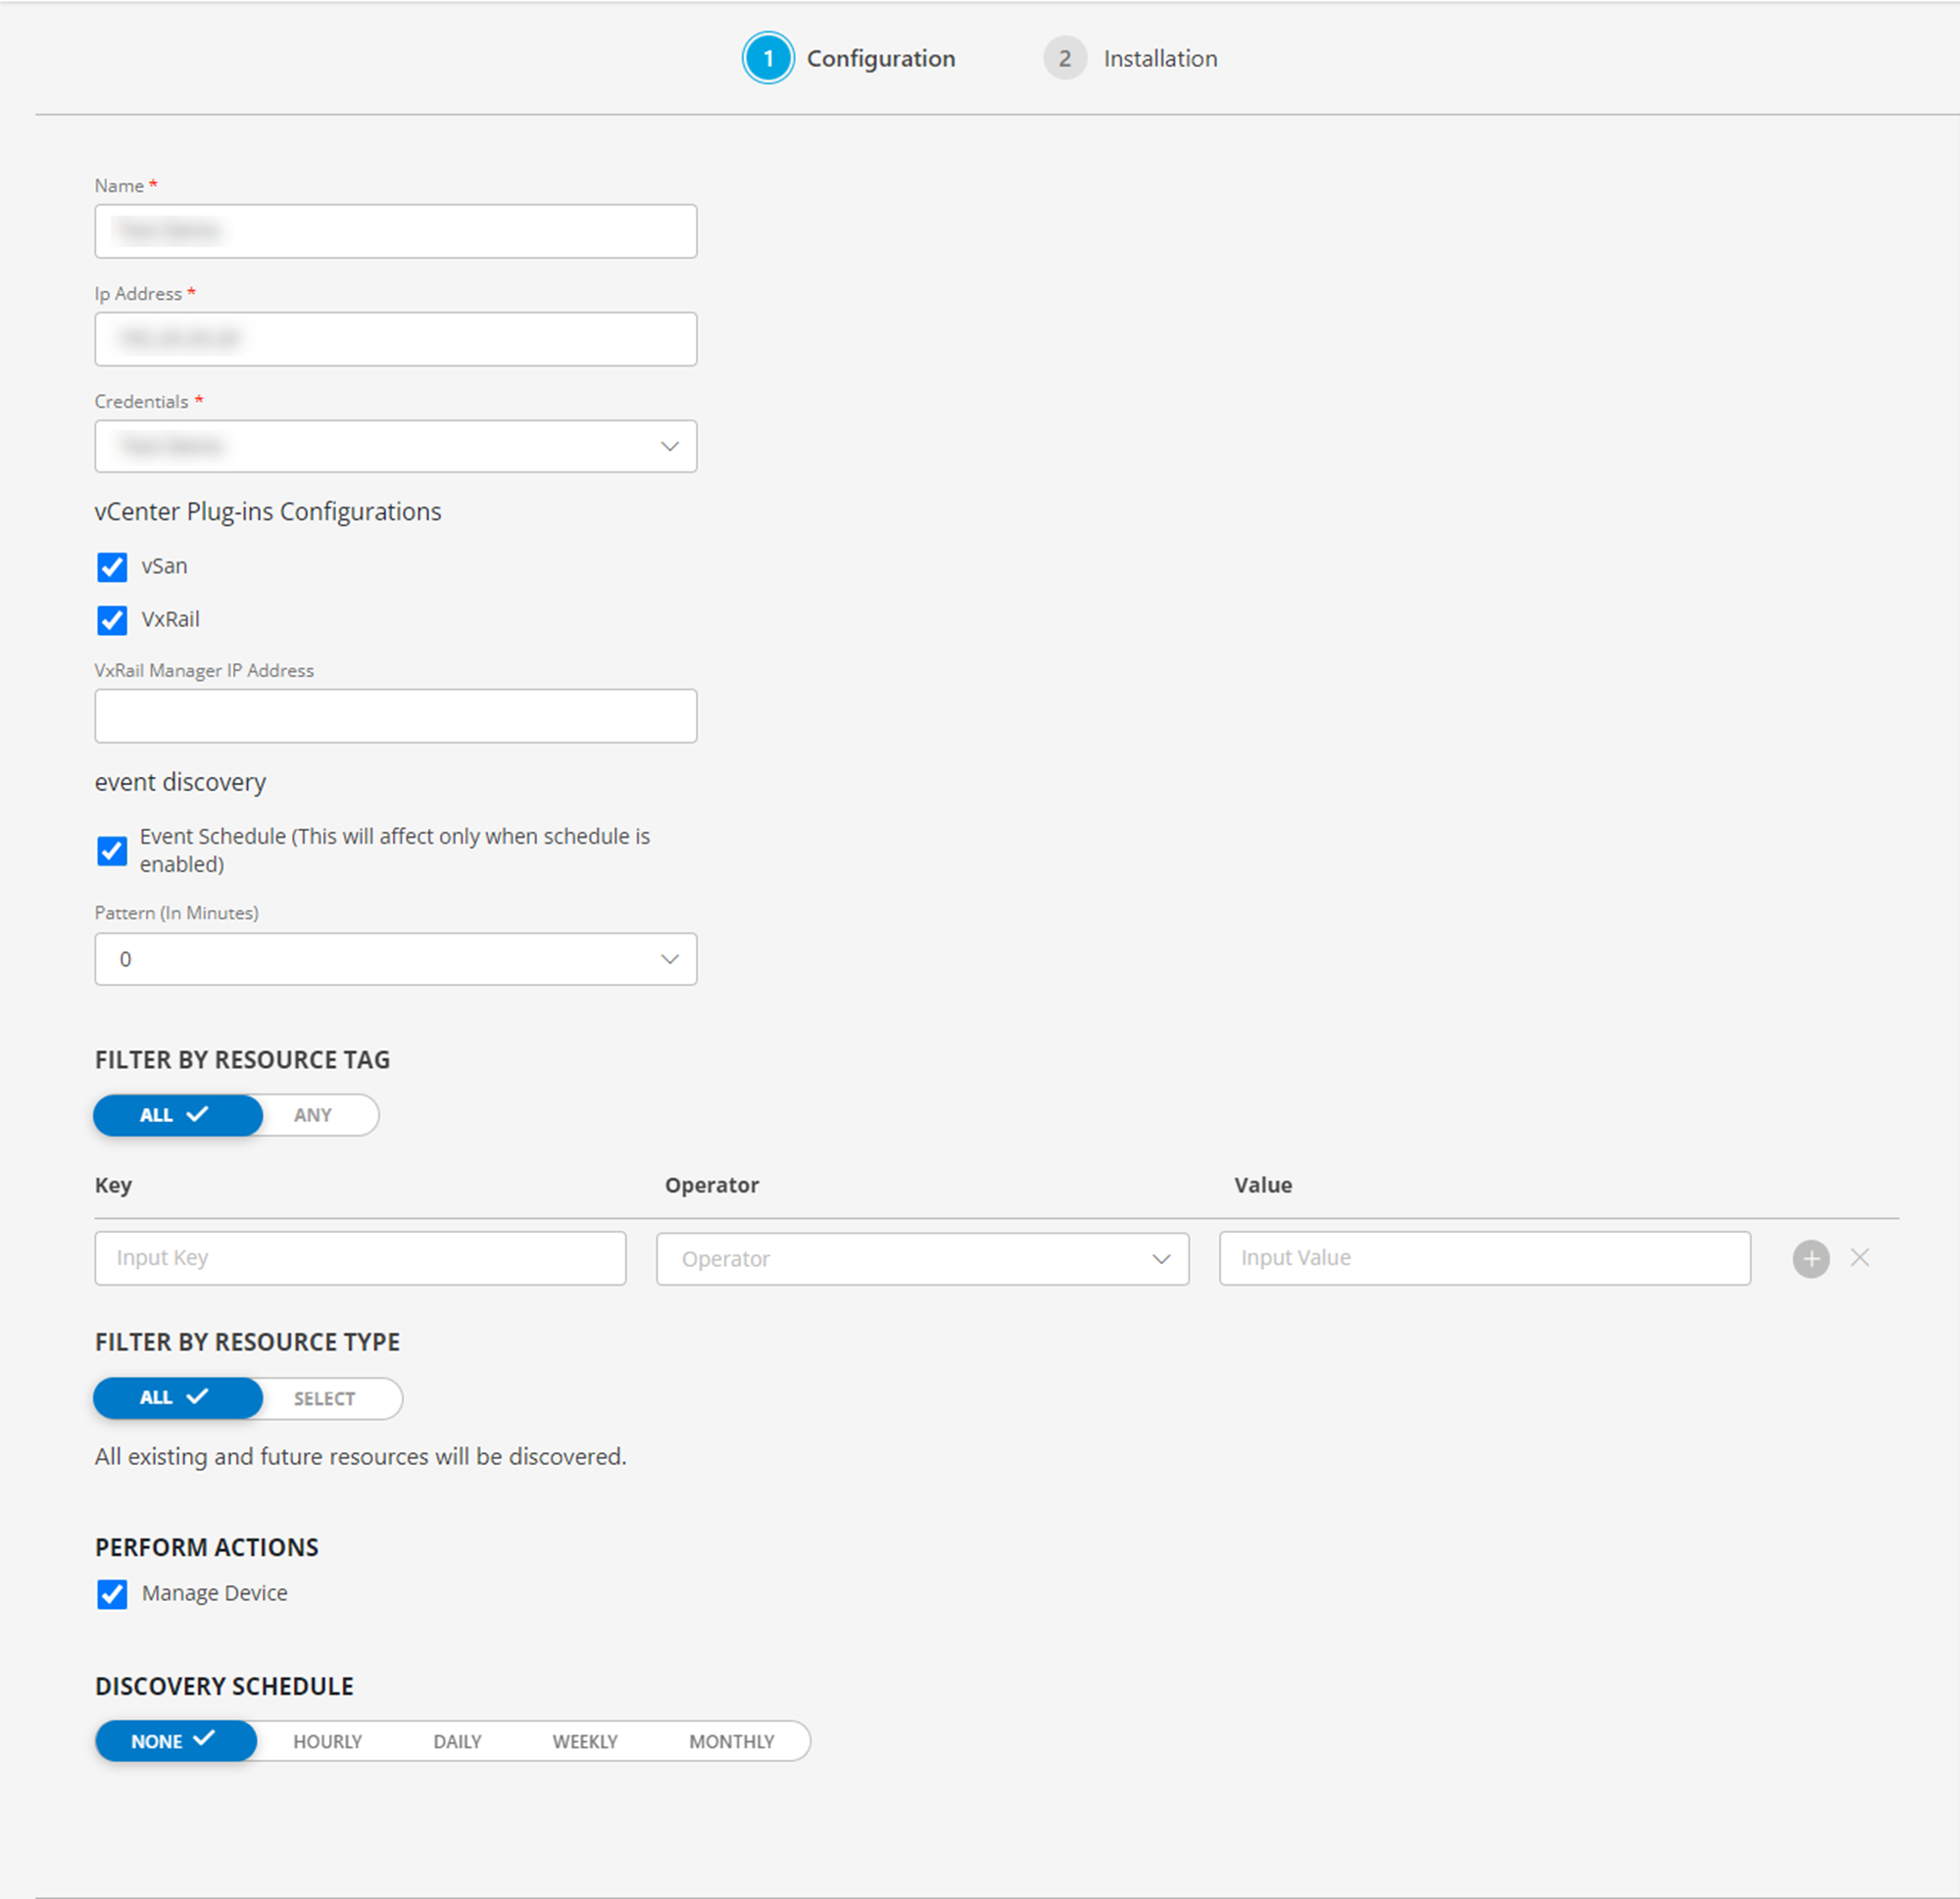
- The Configuration page is displayed, enter the below information:
- Name: Configuration name.
- IP Address/dnsName: IP Address or DNS Name of the vCenter.
- CredentialSet: You can select a credential from the list or add a credential.
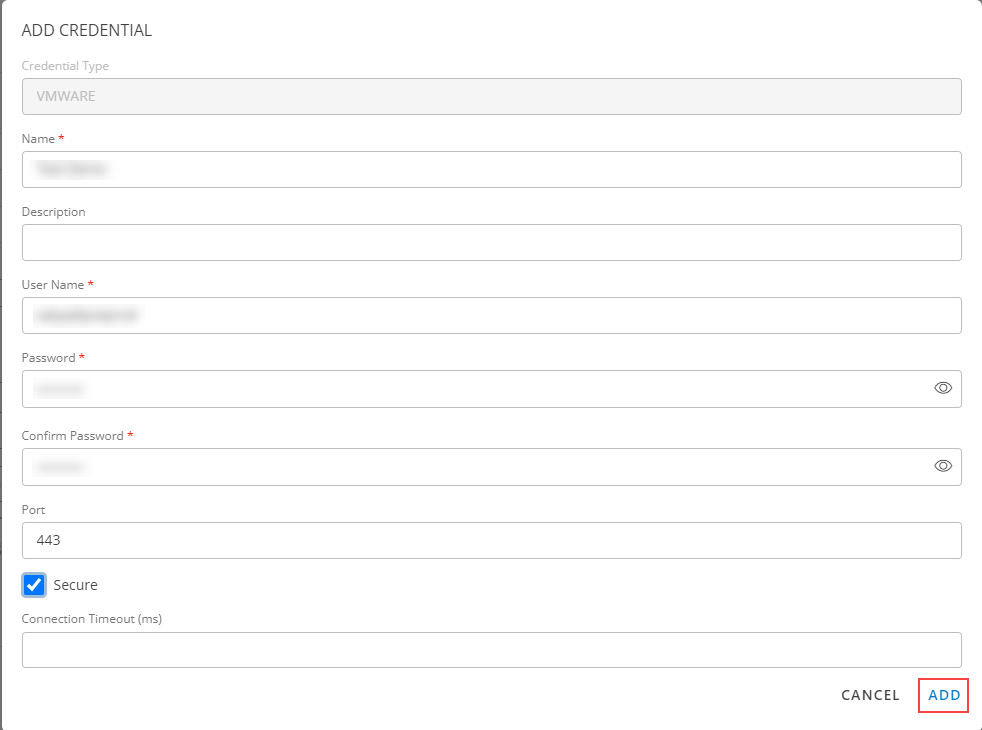
Note: To add a credential:- Click + ADD available in the CredentialSet dropdown. The ADD CREDENTIAL page is displayed. Enter the following information:
- Name: Credential name.
- Description: Brief description of the credential.
- User Name: User name. If you use a domain account to access vCenter, specify the domain with the username in the format
<name of the user>@<domain name>. - Password: Password of the vCenter
- Confirm Password: Confirm password
- Port: Port of the vCenter. Set
443for a secure connection. - Secure: Select the Secure checkbox for encryption.
- Connection Timeout (ms): Timeout in milliseconds.
- Click ADD to add the credential to the credential list.
- Click + ADD available in the CredentialSet dropdown. The ADD CREDENTIAL page is displayed. Enter the following information:
- vCenter Plug-ins Configurations: Enable the vSAN or VxRail check box and enter VxRail manager IP Address.
Note:- For VxRail Components discovery and monitoring, Virtual Machine Discovery is mandatory.
- For vSAN components discovery and monitoring, VMware Cluster discovery is Mandatory.
- Event Schedule: Enable the Event Schedule checkbox.
Notes:- Event Schedule option is displayed if and only if Discovery Schedule option is enabled.
- VMware Inventory begins when following events are identified at
Vcenter: VmClonedEvent, VmDeployedEvent, VmCreatedEvent, VmRemovedEvent, VmRestartedOnAlternateHostEvent, VmRelocatedEvent, VmMigratedEvent, DrsVmMigratedEvent.
- FILTER BY RESOURCE TAG: Click Any or All of the rules below to match any one or all of the conditions you define for filtering.
- Enter/select the values in the Key, Operator, and Value fields for filtering the resources.
- FILTER BY RESOURCE TYPE:
- ALL: All the existing and future resources will be discovered.
- SELECT: You can select one or multiple resources to be discovered.
- PERFORM ACTION: Select the Manage Device checkbox, if you want the discovered devices to be managed.
- Discovery Schedule: Discovery is triggered based on the scheduled time. New resources added to the environment are automatically discovered.
Choose one of the following Recurrence Patterns:
- Hourly
- Daily
- Weekly
- Monthly
- None (On-demand discovery)
- Click NEXT.
- In the Installation page, select an existing registered gateway profile, and click FINISH.
Note: The selected gateway should be up and running.
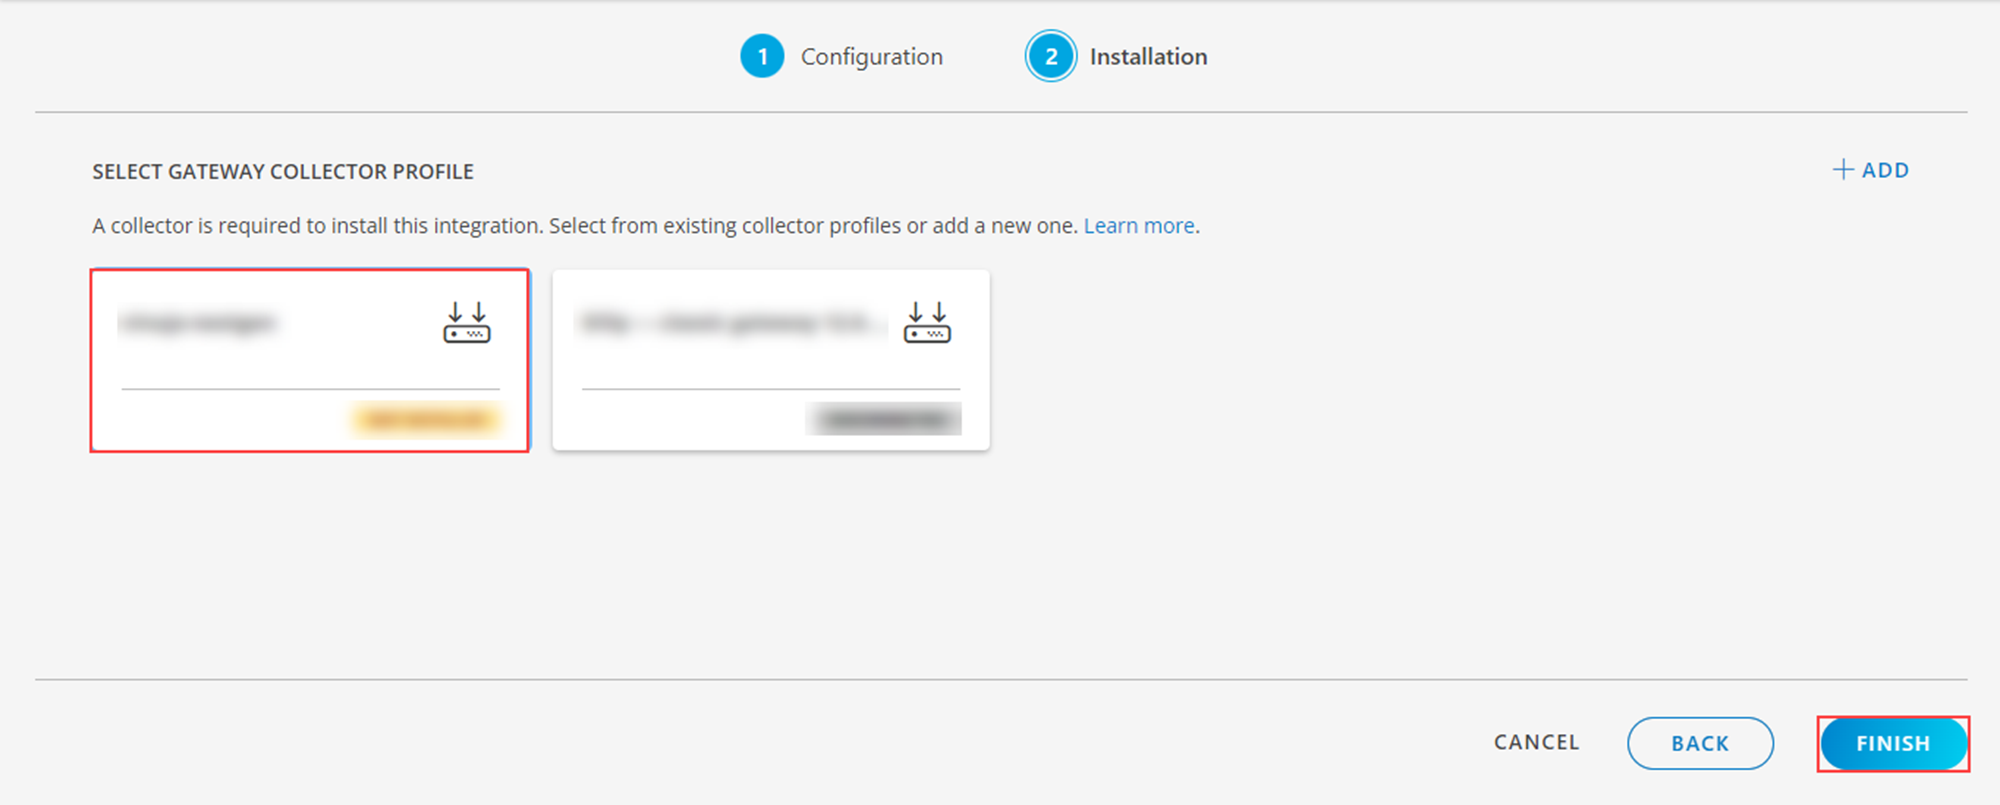
- The VMware integration is installed and displayed on the INSTALLED INTEGRATIONS page.
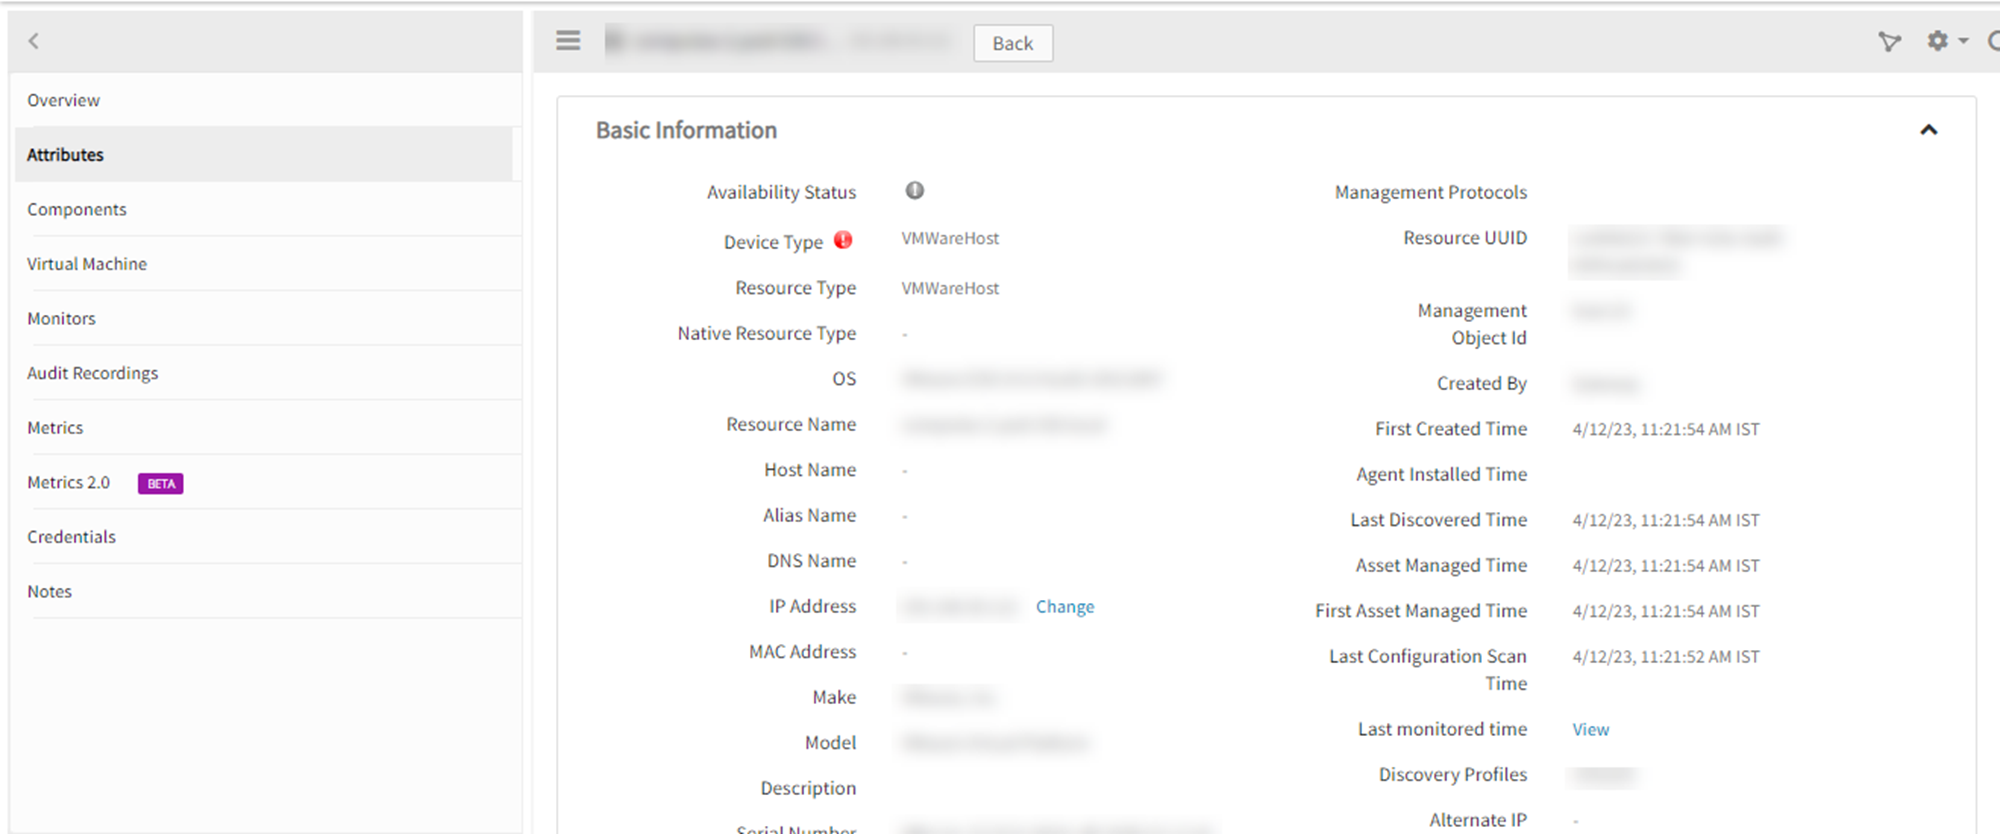
View VMware details
The discovered resource(s) are displayed in Infrastructure > Resources >VMware, with Native Resource Type as VMWareHost. You can navigate to the Attributes tab to view the discovery details.
Notes
Our tool performs VMware monitoring in the following manner:
- A session is initiated with the vCenter/ESXi device at the outset, and it remains operational until the session is active.
- If the session becomes inactive or if the vProbe service is restarted, a new session is created.
Assign Monitoring templates to the resource
- Go to Infrastructure > Resources > VMware.
- On the Resources page of VMware, click resource name > resource Details > Monitors > Template.
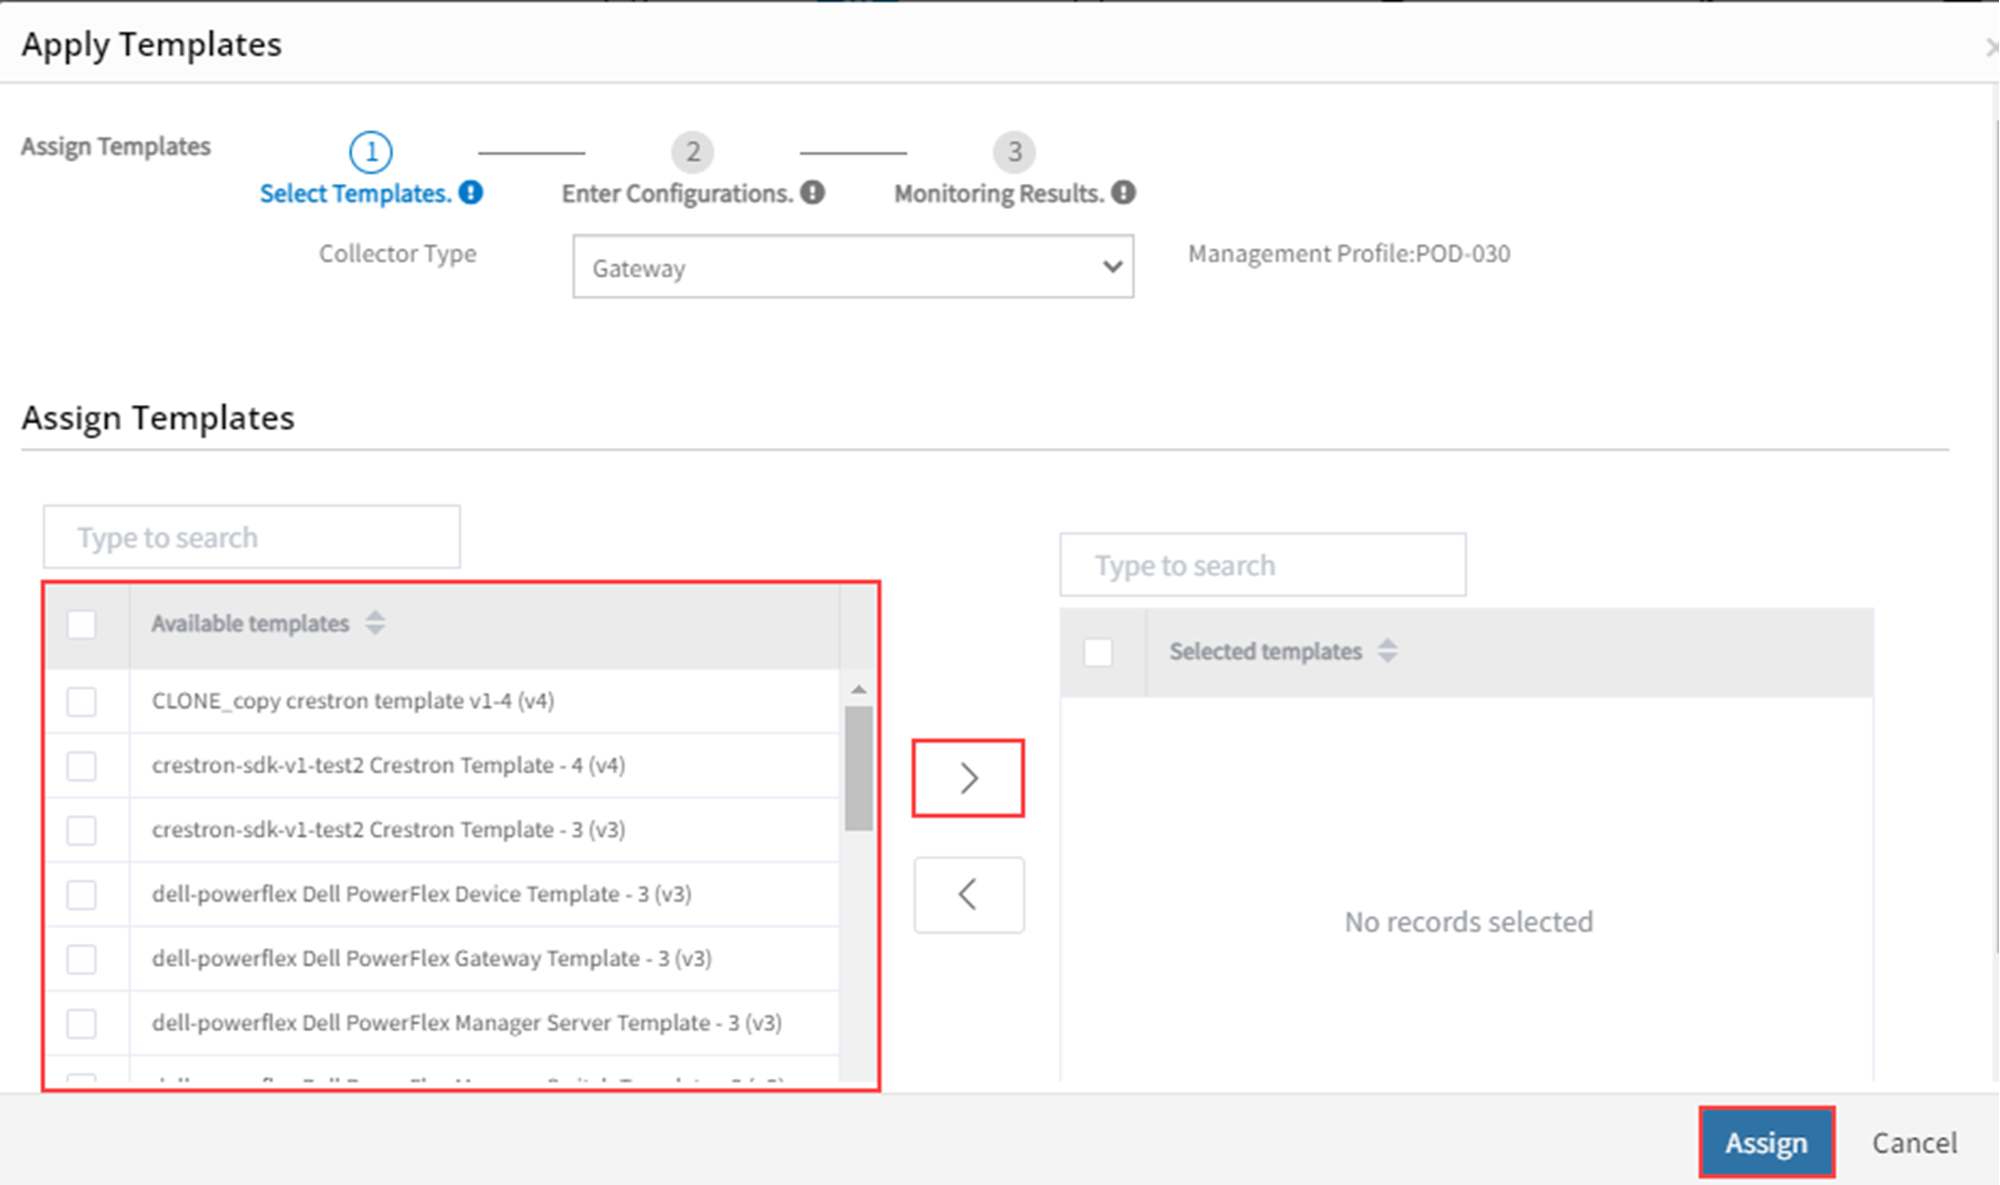
- On the Templates screen, click +Assign Templates.
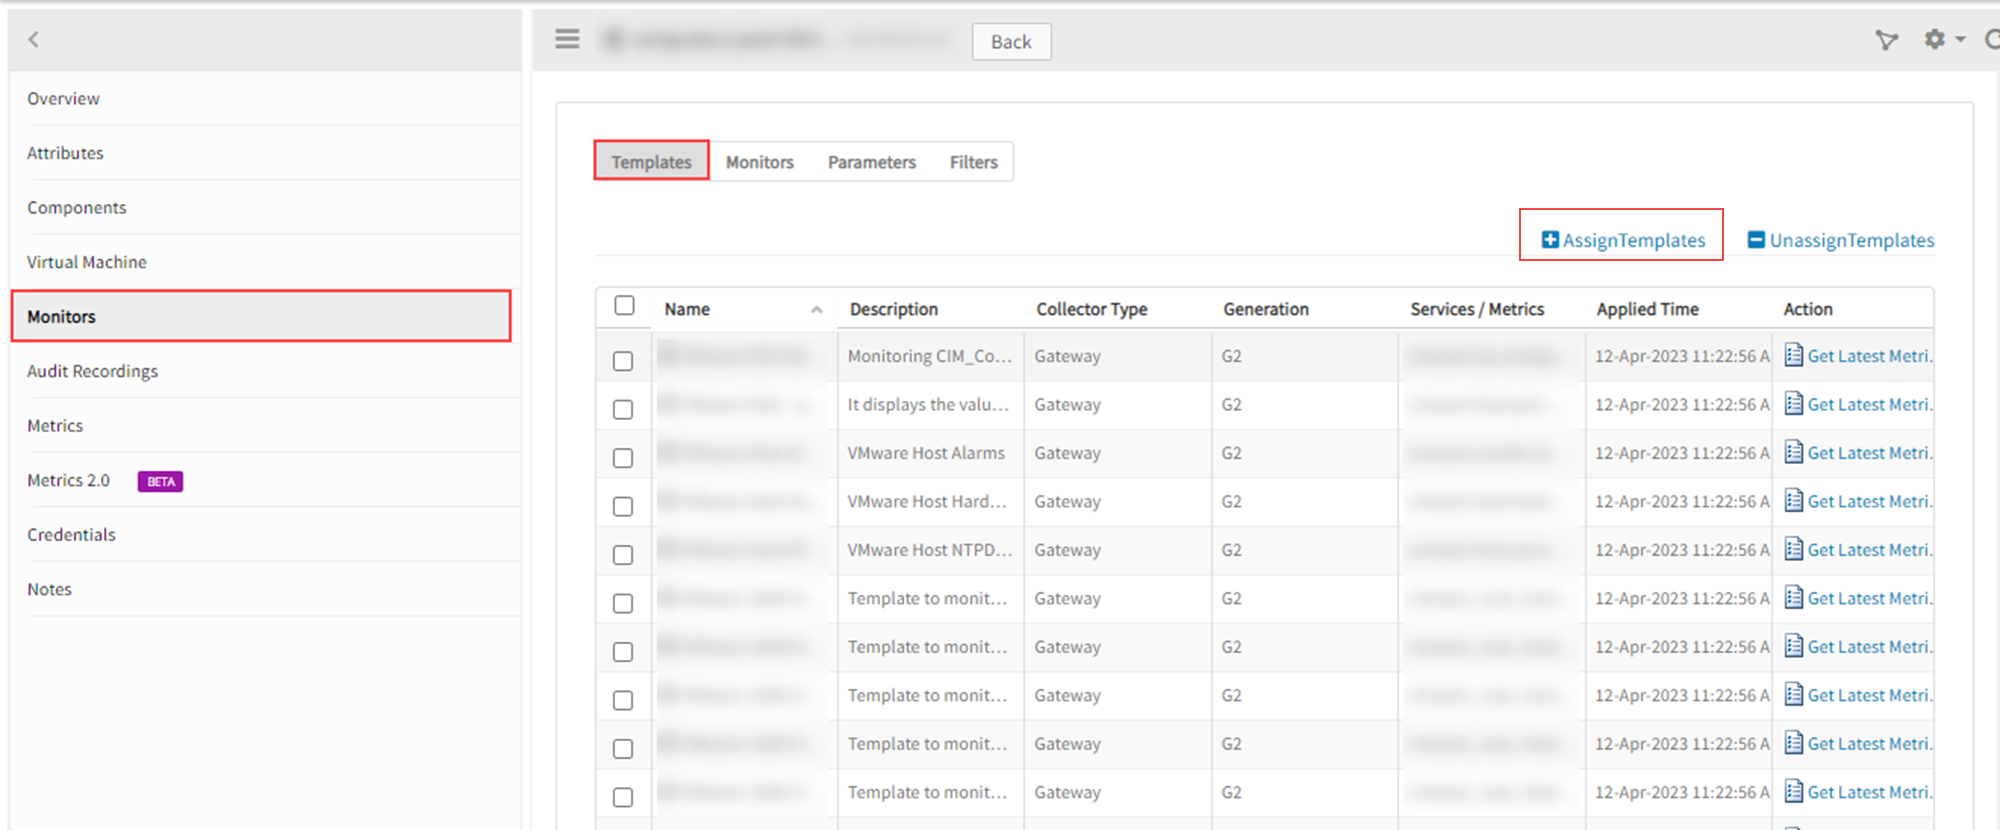
- In the Apply Templates section, AssignTemplates > Available templates, select the templates and click the > button.
- Click Assign. The Templates screen displays the selected templates.
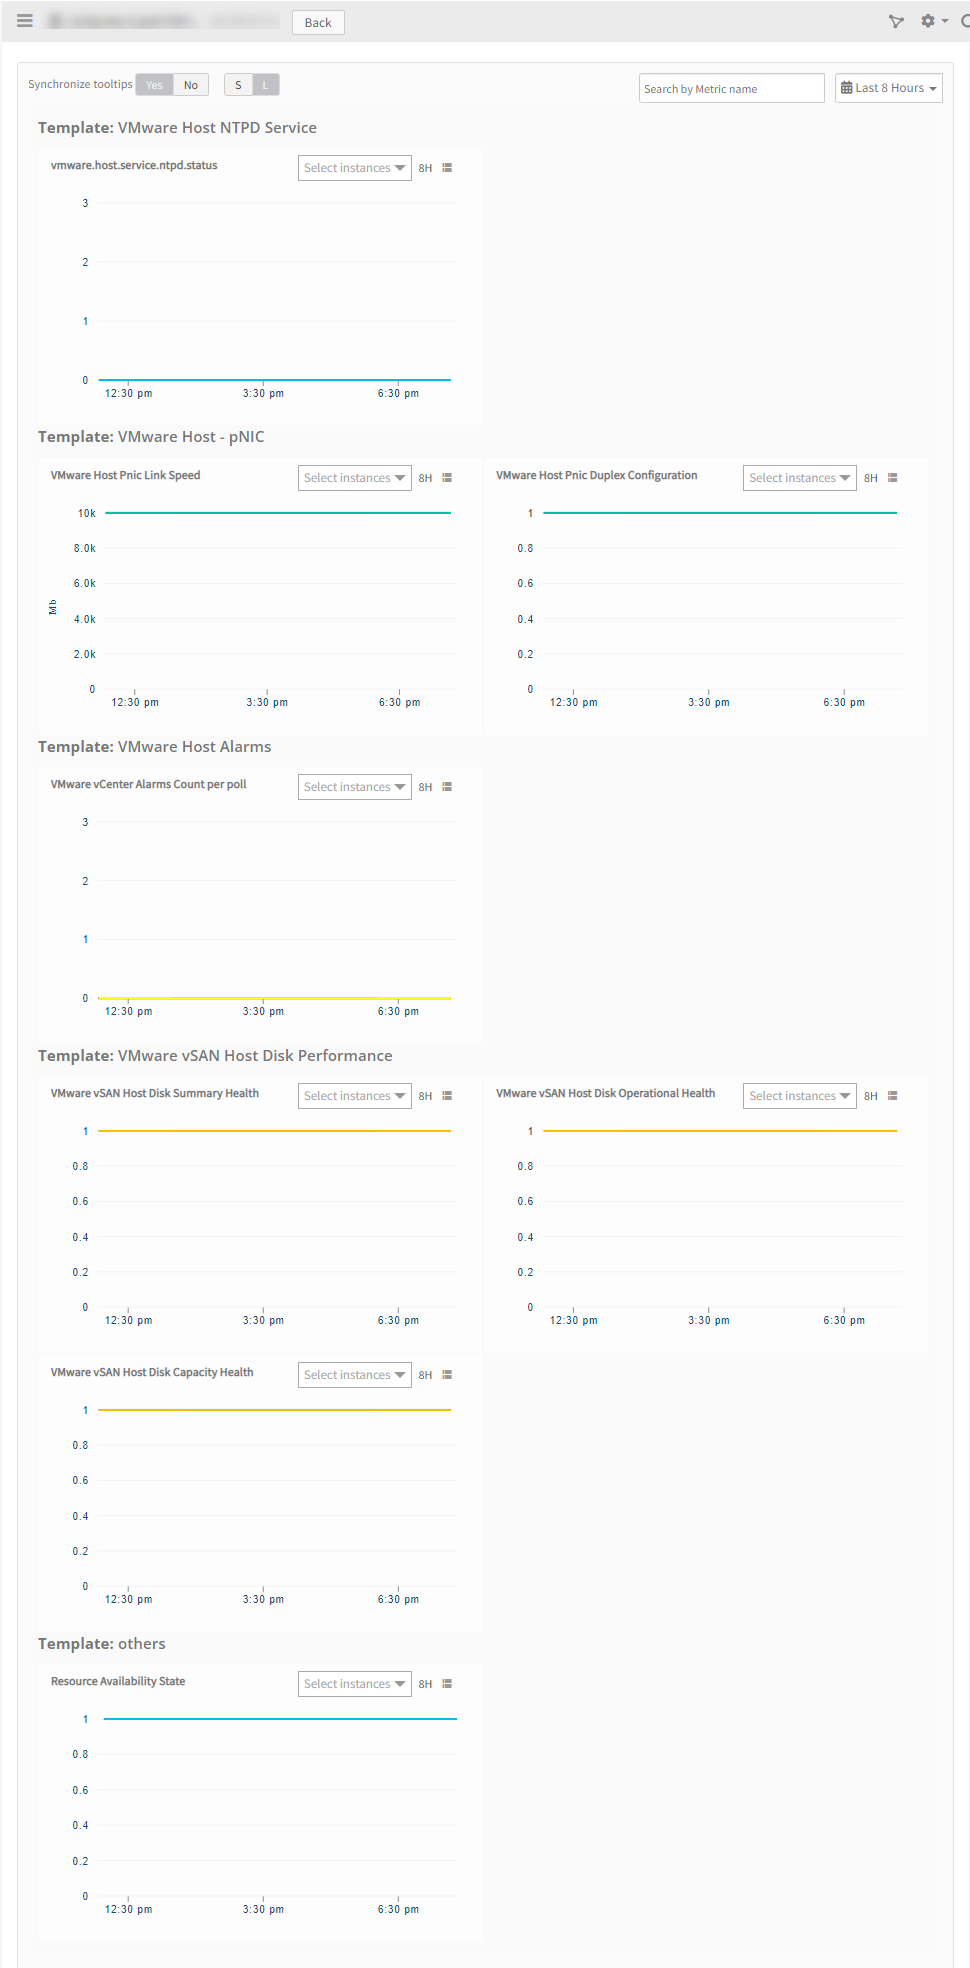
The gateway monitors the application using the assigned templates and displays the results in a graphical format.
While applying a template to a resource, you can customize the default configuration parameters applied to that template.
| Configuration Parameter | Description |
|---|---|
| Connection Time-out | Maximum time to connect to the application. The driver waits for the specified time before timing out due to connection failure. The default time is 10000 milliseconds(ms). |
| VMware API Port | Port number where VMware is running. The connection is made to the specified port if you specify the port and the resource name. The default port is 443. |
| VMware Events Include Security | Events triggered from gateway to cloud while applying a vCenter event template. The different events available are:
|
To confirm the monitoring of VMware resource, review the following:
- The graph is plotted for each metric in the template.
- Alerts are generated for metrics in the template by giving thresholds.
The Metrics tab to view the metric details for VMware.
VMware Recommended templates
The recommended templates for VMware in each entity level
| Resource Type | Template name | Description | Credentials |
|---|---|---|---|
| Vcenter | VMware vCenter Performance - v5 | It collects the performance data of vCenter related to components like CPU, memory, disk etc. All the metrics in this template will be working on vmware 7.0,8.0 versions from gateway version 14.0.0 on-wards, when the metric collection level at vcenter is set to 1. | |
| VMware vCenter All Alarms | Collects data of the triggered alarms on vCenter and child devices and show as alerts (It is recommended to apply this template to the vCenter to capture alarms of vCenter and its child resources as well. Avoid applying resource specific alarm templates directly to child resources.). | ||
| VMware vCenter Appliance Performance - v2 | Monitors the health, resource usage, and performance of the VMware vCenter Server Appliance. | SSH creds | |
| VMware vCenter Appliance Storage Statistics | Monitors the VMware vCenter Appliance Storage Statistics like com.vmware.appliance.version1.resources.storage.stats.list.total.inodes,com.vmware.appliance.version1.resources.storage.stats.list.used.inodes,com.vmware.appliance.version1.resources.storage.stats.list.total.space,com.vmware.appliance.version1.resources.storage.stats.list.used.space. | SSH creds | |
| Gateway - VMware VCenter Appliance Certificates Expiry - v2 | Monitors VMware vCenter Certificate(s) Expiry In Days. pre-requisites: 1. This template will be applicable to VMware vCenter Appliance and tested in VMware version: VMware 6.7.0 build-8170161 2. Bash prompt must be enabled on target device. Command for enabling bash prompt on vmware vcenter appliance machine: shell.set --enabled true. | SSH creds | |
| Gateway - VMware VCenter Appliance Service Status - v2 | Monitors VMware vCenter Service(s) status. It collects service status information by executing this command "service-control --status" from appliance shell. | SSH creds | |
| VMware vCenter Events | Collects the events generated on vmware devices. | ||
| VMware vCenter RP4VMs Events | Monitors vCenter RP4VMs Events and it requires 16.2.0 gateway or later. | ||
| VMware vCenter RP4VMs TransferStatus | It monitors the VMware vCenter RP4VMs consistency group transfer status. This requires 16.2.0 version Gateway or later. | ||
| Datacenter | VMware Datacenter Alarms | Collects data of the triggered alarms on datacenter (It doesn’t collect alarms of child entities). | |
| Cluster | VMware Cluster Performance - v7 | This template is to monitor the performance data of cluster related to components like CPU, disk, memory etc. In this version of template support for additional performance metric vmware_cluster_host_down_count is added. | |
| VMware Cluster Extended Template - v2 | This template is to monitor VMware cluster Overall CPU and Memory Utilization. This template is validated against vCenter 6.7 version. It works with OpsRamp Gateway version 12.0.0 or above and OpsRamp SaaS Version 11.0.0 HF U06 or above. | ||
| VMware Cluster Alarms | Collects data of the triggered alarms on cluster (It doesn’t collect alarms of child entities). | ||
| Host | VMware Host Performance Extended Template | It monitors the additional VMware performance metrics. This is supported from gateway version 21.0.0. | |
| VMware Host Performance - v11 | This template is to monitor the performance data of host related to components like CPU, disk, memory etc. In this version of template, support for performance metric vmware_cpu_readiness_average is added. | ||
| VMware Host NTPD Service | This template is for checking the status of the Network Time Protocol (NTP) daemon (ntpd) running on a VMware ESXi host. | ||
| VMware Host Hardware Health Status - v3 | This is to monitor the host hardware components like temperature, fans, batteries ,processors etc. vmware.host.hardware.chassis-health.status,vmware.host.hardware.softwarecomponents-health.status metrics are excluded from the previous version template as they are no longer supported by vmware API and the metrics vmware.host.hardware.other.status, vmware.host.hardware.cableinterconnect-health.status,vmware.host.hardware.system-health.status requires gateway version 14.0.0 or later. | ||
| VMware Host Extended Template | This template is validated for vCenter 6.7 version. Works for Gateway with 9.0.0 and above version. | ||
| VMware Host Alarms | Collects data of the triggered alarms on esxi host (It doesn’t collect alarms of child entities). | ||
| VMware Host - pNIC | It displays the value as 1 if link is capable for full-duplex and value as 0 if the link is capable only for half-duplex and this requires gateway 12.0.0 or later. | ||
| VMware ESX Hardware Status | It monitors health and operational states of multiple components like sensors, processors, storage, batteries and so on. | separate CIM creds for esxi host if the default vcenter creds have no CIM privilege or if the host is discovered as standalone. | |
| Datastore | VMware Datastore Performance - v5 | This template monitors the performance data of the datastore. The metrics vmware.datastore.totalWriteLatency.average, vmware.datastore.totalReadLatency.average, vmware.datastoreVMObservedLatency.latest, vmware.datastore.datastoreIops.average are excluded from the version v3 template as they are no longer supported by vmware API and the metric "vmware.datastore.capacity.usage" is also excluded which is a duplicate of "vmware.datastore.disk.usedCapacity.percentage". From gateway version 14.0.0 onwards, when the metric collection level at vCenter is set to 1, all metrics in this template will work on VMware 7.0. For VMware 8.0, metrics vmware.datastore.numberReadAveraged.average and vmware.datastore.numberWriteAveraged.average will not work at collection level 1. | |
| VMware DataStore - Disk Performance | It monitors additional performance metrics like VMware disk number Read summation, VMware disk number read averaged average, VMware disk number write summation, VMware disk number write averaged average. | ||
| VMware DataStore - Disk Performance – v2 | The metrics vmware.disk.numberWrite.summation and vmware.disk.numberRead.summation are excluded from the previous version template as they are no longer supported by VMware API. This template works from gateway version 14.0.0. | ||
| VMware Datastore Extended Template | Monitors vmware.datastore.swap.size and vmware.datastore.snapshot.used.latest. This template is validated for vCenter 6.7 version. Works for Gateway with 9.0.0 and above version. | ||
| VMware Datastore Alarms | Collects data of the triggered alarms on datastore. | ||
| Virtual Machine | |||
| VMware VirtualMachine Performance Extended Template | It monitors the additional VMware performance metrics. This is supported from gateway version 21.0.0. | ||
| VMware VirtualMachine Performance - v12 | This template is to monitor the performance data of host related to components like CPU, disk, memory etc. In this version of template, it monitors additional performance metric vmware_cpu_readiness_average.. This template requires gateway version 20.1.0 or later. | ||
| VMware VirtualMachine Extended Template | It monitors vmware.disk.busResets.summation and vmware.vm.log.size. This template is validated for vCenter 6.7 version. Works for Gateway with 9.0.0 and above version. | ||
| VMware VM - Memory Performance | It monitors additional performance metrics like VMware memory usage, VMware memory overhead average. | ||
| VMware VirtualMachine Alarms | Collects data of the triggered alarms on virtual machine. | ||
| VMware VM Snapshot Ageing Monitor | It monitors the VMware virtual machine snapshots age information. It works from gateway version 14.1.0 onwards. |
VMware Alarms Document
Create custom alarm metrics
- Navigate to Setup > Monitoring > Events.
- Click +Add at the right top corner.
- For Adapter Type, select VMware.
- In the name field, the metric name should be added as follows:
For user defined alarms, the sysname is null. In that case, add the metric name in this format:
“vmware_vcenter_alarm_”+alarmName. Here, alarmName should not have any spaces.
Example: If a user defines an alarm with name memory Limit Alarm, then the metric name should be created as vmware_vcenter_alarm_memoryLimitAlarm.
Note
According to the design, VMware alarm metric thresholds and alert configurations will not function within VMware alarm templates.
Replace special characters in alarm name (if any) with ‘_’ (underscore) while creating custom alarm metric.
For example, if the alarm name created in vcenter is VM power ON for vcenter-sjc06.opsramp.lab then metric name should be vmware_vcenter_alarm_VMpowerONforvcenter_sjc06_opsramp_lab
Key Use Case
The following paramaters outlines the current design for events and alarms:
Retrieving all alarms and events on vCenter
When an alarm or event template is assigned to vCenter, all alerts pertaining to vCenter, Data Centers, DataStores, Hosts, and VMs are mapped to the vCenter.
Configuration parameters
| Configuration Parameter | Description |
|---|---|
| vmware.vcenter.alarm.policy | If "vmware.vcenter.alarm.policy" is set to "all," OpsRamp will currently monitor all alarms. If "vmware.vcenter.alarm.policy" is set to "include", it will only track the alarms that are used as metrics. Note:
|
| vmware.vcenter.alarm.exclude.entity.list | If an alert's severity type is added to the "vmware.vcenter.alarm.exclude.entity.list" configuration parameter in comma-separated format, our tool will skip that alarm type. Possible values of this parameter are: VirtualMachine,Template, Datacenter, Folder, HostSystem, VirtualApp, ResourcePool, ComputeResource, ClusterComputeResource, DistributedVirtualSwitch, DistributedVirtualPortgroup, Datastore, Network, StoragePod, Datacenters. |
| vmware.vcenter.alarm.exclude.severity.list | If a specific severity type is supplied in comma separated format to the "vmware.vcenter.alarm.exclude.severity.list" configuration parameter, our tool will skip alerts with that severity. |
| vmware.vcenter.alarm.receive.child.alarms | Only after applying the template to the vCenter Entity are child alarms monitored. If “vmware.vcenter.alarm.receive.child.alarms” config param value is set to “no” then our tool will not process the child alarms and this parameter is applicable for vCenter entity only. Note: The default value of this parameter is “yes”. |
| vmware.alarms.regex.match | When a regular expression is given as input to the "vmware.alarms.regex.match" pattern, the alarm will be processed if its alarm name or sys name matches the regular expression. Here, the "vmware.vcenter.alarm.policy" should be set to "all". Note: The default value of this parameter is set as "None". |
Deprecated Parameters
The following two configuration options are being deprecated starting with the 14.1.0 gateway version:
- Vmware.vcenter.process.native.alarms
- Vmware.vcenter.process.thirdparty.alarms
Supported alarms
Currently OpsRamp supports the below alarms
| Metric Name | Description |
|---|---|
| vmware.vcenter.alarm.ApplmgmtHealthAlarm | Monitors the health status of the Appliance Management Service. |
| vmware.vcenter.alarm.BatteryHealthAlarm | Monitors the battery status of hosts. |
| vmware.vcenter.alarm.BMCHealthAlarm | Monitors the status of the Baseboard Management Controller. |
| vmware.vcenter.alarm.CertificateStatusAlarm | Monitors the certificate status of an ESXi host. |
| vmware.vcenter.alarm.ComponentMgrHealthAlarm | Monitors Component Manager Service Health |
| vmware.vcenter.alarm.ConsistencyGroupViolation | Datastore cluster has datastores that belong to different SRM consistency groups. |
| vmware.vcenter.alarm.ContentLibraryServiceHealthAlarm | Monitors the health status of the VMware Content Library Service. |
| vmware.vcenter.alarm.DatastoreDiskUsageAlarm | Monitors datastore disk usage. |
| vmware.vcenter.alarm.DatastoreInMultipleDatacenters | Monitors whether a datastore in a datastore cluster is visible in more than one data center. |
| vmware.vcenter.alarm.DatastoreStorageComplianceAlarm | Monitors whether the virtual disk on the datastore complies with the object-based storage. |
| vmware.vcenter.alarm.DBHealthAlarm | |
| vmware.vcenter.alarm.DSHealthAlarm | Monitors the health status of the Data Service. |
| vmware.vcenter.alarm.EAMHealthAlarm | Monitors the health status of the ESX Agent Manager. |
| vmware.vcenter.alarm.ExitStandbyErrorAlarm | Monitors whether a host cannot exit standby mode. |
| vmware.vcenter.alarm.FailoverFailedAlarm | |
| vmware.vcenter.alarm.FanHealthAlarm | Monitors host fans. |
| vmware.vcenter.alarm.HAcannotFindMaster | Monitors whether vCenter Server is able to connect to a vSphere High Availability master agent. |
| vmware.vcenter.alarm.HAfailoverFailed | Monitors the failover progress of vSphere High Availability. |
| vmware.vcenter.alarm.HAfailoverInProgress | Monitors the failover progress of vSphere High Availability. |
| vmware.vcenter.alarm.HAhostStatus | Monitors the host health status reported by vSphere High Availability. |
| vmware.vcenter.alarm.HAinsufficientFailoverResources | Monitors the sufficiency of failover cluster resources required for vSphere High Availability. |
| vmware.vcenter.alarm.HardwareSensorStateChange | |
| vmware.vcenter.alarm.HAvmMonitoringAction | Monitors whether vSphere High Availability has restarted a virtual machine. |
| vmware.vcenter.alarm.HAvmMonitoringError | Monitors whether vSphere High Availability failed to reset a virtual machine. |
| vmware.vcenter.alarm.HealthStatusChangedAlarm | Monitors changes to service and extension health status. |
| vmware.vcenter.alarm.HostCertManagementModeChangedAlarm | Monitors changes in the certificate management mode of vCenter Server. |
| vmware.vcenter.alarm.HostCertStatusAlarm | Monitors the certificate status of an ESXi host. |
| vmware.vcenter.alarm.HostConnectionStateAlarm | Monitors the power state of the host and whether the host is reachable. |
| vmware.vcenter.alarm.HostConnectivityAlarm | Monitors host connectivity to a storage device. |
| vmware.vcenter.alarm.HostCPUUsageAlarm | Monitors host CPU usage. |
| vmware.vcenter.alarm.HostErrorAlarm | Monitors host error and warning events. |
| vmware.vcenter.alarm.HostEsxCosSwapAlarm | Monitors host service console memory swap rates. |
| vmware.vcenter.alarm.HostIpConflictAlarm | |
| vmware.vcenter.alarm.HostLicenseEditionNotAllowed | Monitors the compatibility of the vCenter Server and host license editions. |
| vmware.vcenter.alarm.HostMemoryUsageAlarm | Monitors host memory usage. |
| vmware.vcenter.alarm.HostRequiresEncryptionModeEnabledAlarm | |
| vmware.vcenter.alarm.HostVendorProviderRegistrationAlarm | Default alarm that monitors whether the registration or unregistration of a VASA vendor provider on a vSAN host fails. |
| vmware.vcenter.alarm.IdentityHealthAlarm | Monitors the health status of the Identity Management Service. |
| vmware.vcenter.alarm.ImageBuilderHealthAlarm | |
| vmware.vcenter.alarm.InventoryHealthAlarm | Monitors the health status of the Inventory Service. |
| vmware.vcenter.alarm.IoFilterHostVendorProviderRegistrationAlarm | Default alarm that monitors whether vCenter Server fails to register or unregister third-party IO filter storage providers on a host. |
| vmware.vcenter.alarm.IoFilterManagementOperationAlarm | vSphere APIs for IO Filtering (VAIO) Filter Management Operations. |
| vmware.vcenter.alarm.IormNonVIWorkloadAlarm | Monitors the unmanaged I/O workload on a SIOC-enabled datastore. |
| vmware.vcenter.alarm.KMSClientCertificateStatusAlarm | |
| vmware.vcenter.alarm.KMSServerCertificateStatusAlarm | |
| vmware.vcenter.alarm.LicenseCapacityExceededAlarm | Monitors whether a license capacity is exceeded. |
| vmware.vcenter.alarm.LicenseError | Monitors license errors. |
| vmware.vcenter.alarm.LicenseExpiredHost | Monitors the expiry of host license. |
| vmware.vcenter.alarm.LicenseExpiredVc | Monitors vCenter Server license expiry. |
| vmware.vcenter.alarm.LicenseHealthAlarm | Monitors the health status of the License Service. |
| vmware.vcenter.alarm.LicenseNonComplianceAlarm | Monitors the license inventory for compliance. |
| vmware.vcenter.alarm.LicenseUserThresholdExceededAlarm | Monitors whether a user-defined license threshold is exceeded. |
| vmware.vcenter.alarm.LunCapabilityAlarm | Monitors the change in the capability status for volumes backing the datastore. |
| vmware.vcenter.alarm.MemoryHealthAlarm | Monitors host memory usage. |
| vmware.vcenter.alarm.MigrateBindToVMKAlarm | Monitors incorrectly configured VMkernel NICs. |
| vmware.vcenter.alarm.MigrationErrorAlarm | Monitors whether a virtual machine cannot be migrated or relocated, or is orphaned. |
| vmware.vcenter.alarm.MsgBusHealthAlarm | Monitors the health status of the Message Bus Configuration Service. |
| vmware.vcenter.alarm.NetdumperHealthAlarm | Monitors the health status of the VMware vSphere ESXi Dump Collector Service. |
| vmware.vcenter.alarm.NetworkConnectivityLostAlarm | Monitors the network connectivity on a virtual switch. |
| vmware.vcenter.alarm.NetworkRedundancyDegradedAlarm | Monitors network uplink redundancy degradation on a virtual switch. |
| vmware.vcenter.alarm.NetworkRedundancyLostAlarm | Monitors network uplink redundancy on a virtual switch. |
| vmware.vcenter.alarm.OtherHealthAlarm | Monitors other host hardware objects. |
| vmware.vcenter.alarm.PerfchartsHealthAlarm | Monitors the health status of the Performance Charts Service. |
| vmware.vcenter.alarm.PowerHealthAlarm | Monitors the host power status. |
| vmware.vcenter.alarm.ProcessorHealthAlarm | Monitors the host processors. |
| vmware.vcenter.alarm.RBDHealthAlarm | Monitors the health status of the vSphere Auto Deploy Waiter. |
| vmware.vcenter.alarm.SELHealthAlarm | Monitors the capacity of the IPMI system event log. |
| vmware.vcenter.alarm.ServiceControlAgentHealthAlarm | Monitors the health status of the VMware Service Control Agent. |
| vmware.vcenter.alarm.SpsHealthAlarm | Monitors the health status of the VMware vSphere Profile-Driven Storage Service. |
| vmware.vcenter.alarm.StatsmonitorHealthAlarm | |
| vmware.vcenter.alarm.StorageConnectivityAlarm | Monitors host connectivity to a storage device. |
| vmware.vcenter.alarm.StorageHealthAlarm | Monitors host connectivity to storage devices. |
| vmware.vcenter.alarm.StoragePodOutOfSpace | Monitors whether a datastore cluster runs out of disk space. |
| vmware.vcenter.alarm.StoragePodSDRSNotSupportedHost | Monitors and alerts when Storage DRS is not supported on a host. |
| vmware.vcenter.alarm.StoragePodSDRSRecommendation | |
| vmware.vcenter.alarm.StoragePodSDSRecommendation | Monitor Storage DRS recommendations. |
| vmware.vcenter.alarm.SubscriptionLicenseExpiredHost | Monitors the expiry of host time-limited license. |
| vmware.vcenter.alarm.SubscriptionLicenseExpiredVc | Monitors vCenter Server time-limited license expiry. |
| vmware.vcenter.alarm.SubscriptionLicenseExpiredVsan | Monitors the expiry of the vSAN license and the end of the evaluation period. |
| vmware.vcenter.alarm.SystemBoardHealthAlarm | Monitors the status of host system boards. |
| vmware.vcenter.alarm.TemperatureHealthAlarm | Monitors the temperature status of the host hardware. |
| vmware.vcenter.alarm.ThinProvisionedLunAlarm | Monitors whether the thin provisioning threshold on the storage array exceeds for volumes backing the datastore. |
| vmware.vcenter.alarm.TsHealthAlarm | Monitors the health status of the VMware Transfer Service. |
| vmware.vcenter.alarm.UpdateMgrHealthAlarm | |
| vmware.vcenter.alarm.VapiEndpointHealthAlarm | Monitors the health status of the VMware vAPI Endpoint Service. |
| vmware.vcenter.alarm.VasaProviderCertificateExpiryAlarm | Monitors whether VASA provider certificates are getting close to their expiry date. |
| vmware.vcenter.alarm.VasaProviderDisconnectedAlarm | Monitors the changes in the connection state of VASA providers. |
| vmware.vcenter.alarm.VasaProviderObjectAlarm | It tracks vCenter Object Type Storage Alarm. |
| vmware.vcenter.alarm.VasaProviderRefreshCACertsAndCRLsFailureAlarm | Monitors whether the refreshing of CA certificates and CRLs for some of the VASA providers has failed. |
| vmware.vcenter.alarm.VchaHealthAlarm | |
| vmware.vcenter.alarm.VCHAHealthAlarm | |
| vmware.vcenter.alarm.VCServerHealthAlarm | Monitors the health status of vCenter Server. |
| vmware.vcenter.alarm.VdcsHealthAlarm | Monitors Open Virtualization Format Service Health. |
| vmware.vcenter.alarm.VdsHCMTUMatchAlarm | Monitors changes in vSphere Distributed Switch MTU matched status. |
| vmware.vcenter.alarm.VdsHCMTUSupportedAlarm | Monitors changes in vSphere Distributed Switch MTU supported status. |
| vmware.vcenter.alarm.VdsHCTeamingMatchAlarm | Monitors changes in vSphere Distributed Switch teaming matched status. |
| vmware.vcenter.alarm.VdsHCVlanTrunkedAlarm | Monitors changes in vSphere Distributed Switch VLAN trunked status. |
| vmware.vcenter.alarm.VFlashResourceHealthAlarm | Monitors the Flash Read Cache resource status on the host. |
| vmware.vcenter.alarm.VFlashResourceUsageAlarm | Monitors the Flash Read Cache resource usage on the host. |
| vmware.vcenter.alarm.VmAdapterResvervationStatus | Monitors changes in the reservation status of a virtual machine network adapter. |
| vmware.vcenter.alarm.VmcpTerminateVmAborted | Monitors whether vSphere High Availability VM Component Protection cannot power off a virtual machine with an inaccessible datastore. |
| vmware.vcenter.alarm.VmCPUUsageAlarm | Monitors virtual machine CPU usage. |
| vmware.vcenter.alarm.VmCryptoStateLockedAlarm | |
| vmware.vcenter.alarm.VmdirHealthAlarm | |
| vmware.vcenter.alarm.VmDiskConsolidationNeededAlarm | Monitors changes in the virtual machine Consolidation Needed status. |
| vmware.vcenter.alarm.VmErrorAlarm | Monitors virtual machine error and warning events. |
| vmware.vcenter.alarm.VmFaultToleranceLatencyStatusAlarm | Monitors changes in the Fault Tolerance Secondary vLockStep interval. |
| vmware.vcenter.alarm.VmFaultToleranceStateChangedAlarm | Monitors changes in the Fault Tolerance state of a virtual machine. |
| vmware.vcenter.alarm.VmMemoryUsageAlarm | Monitors virtual machine memory usage. |
| vmware.vcenter.alarm.VmNoCompatibleHostForSecondaryAlarm | Monitors the availability of compatible hosts on which a secondary virtual machine can be created and run. |
| vmware.vcenter.alarm.VmonApiHealthAlarm | |
| vmware.vcenter.alarm.VmStorageComplianceAlarm | Monitors virtual disk compliance with the object-based storage. |
| vmware.vcenter.alarm.VmTimedoutStartingSecondaryAlarm | Monitors whether starting a secondary virtual machine has timed out. |
| vmware.vcenter.alarm.VmwareRhttpproxyHealthAlarm | |
| vmware.vcenter.alarm.VmwareSyslogHealthAlarm | Monitors the health status of the VMware Common Logging Service. |
| vmware.vcenter.alarm.VmwareVpostgresHealthAlarm | Monitors the health status of the VMware vFabric Postgres Service. |
| vmware.vcenter.alarm.VoltageHealthAlarm | Monitors host hardware voltage. |
| vmware.vcenter.alarm.VpxdSvcsHealthAlarm | |
| vmware.vcenter.alarm.vsan.health.test.cloudhealth.vsancloudhealthceipexception | |
| vmware.vcenter.alarm.vsan.health.test.cloudhealth.vsancloudhealthconnectionexception | |
| vmware.vcenter.alarm.vsan.health.test.cluster | |
| vmware.vcenter.alarm.vsan.health.test.cluster.advcfgsync | |
| vmware.vcenter.alarm.vsan.health.test.cluster.clomdliveness | |
| vmware.vcenter.alarm.vsan.health.test.cluster.clustermembership | |
| vmware.vcenter.alarm.vsan.health.test.cluster.consistentconfig | |
| vmware.vcenter.alarm.vsan.health.test.cluster.diskbalance | |
| vmware.vcenter.alarm.vsan.health.test.cluster.healtheaminstall | |
| vmware.vcenter.alarm.vsan.health.test.cluster.healthversion | |
| vmware.vcenter.alarm.vsan.health.test.cluster.mmdecominsync | |
| vmware.vcenter.alarm.vsan.health.test.cluster.physdiskdedupconfig | |
| vmware.vcenter.alarm.vsan.health.test.cluster.physdiskdedupusage | |
| vmware.vcenter.alarm.vsan.health.test.cluster.resynclimit | |
| vmware.vcenter.alarm.vsan.health.test.cluster.timedrift | |
| vmware.vcenter.alarm.vsan.health.test.cluster.upgradelowerhosts | |
| vmware.vcenter.alarm.vsan.health.test.cluster.upgradesoftware | |
| vmware.vcenter.alarm.vsan.health.test.cluster.vcauthoritative | |
| vmware.vcenter.alarm.vsan.health.test.data | |
| vmware.vcenter.alarm.vsan.health.test.data.objecthealth | |
| vmware.vcenter.alarm.vsan.health.test.data.vmhealth | |
| vmware.vcenter.alarm.vsan.health.test.encryption.hostcpuaesni | |
| vmware.vcenter.alarm.vsan.health.test.encryption.kmsconnection | |
| vmware.vcenter.alarm.vsan.health.test.hcl | |
| vmware.vcenter.alarm.vsan.health.test.hcl.autohclupdate | |
| vmware.vcenter.alarm.vsan.health.test.hcl.cimproviderinstall | |
| vmware.vcenter.alarm.vsan.health.test.hcl.controllercache | |
| vmware.vcenter.alarm.vsan.health.test.hcl.controllerdiskmode | |
| vmware.vcenter.alarm.vsan.health.test.hcl.controllerdriver | |
| vmware.vcenter.alarm.vsan.health.test.hcl.controllerfirmware | |
| vmware.vcenter.alarm.vsan.health.test.hcl.controlleronhcl | |
| vmware.vcenter.alarm.vsan.health.test.hcl.controllerraid | |
| vmware.vcenter.alarm.vsan.health.test.hcl.controllerreleasesupport | |
| vmware.vcenter.alarm.vsan.health.test.hcl.hcldbuptodate | |
| vmware.vcenter.alarm.vsan.health.test.hcl.hclhostbadstate | |
| vmware.vcenter.alarm.vsan.health.test.iscsi.iscsiHomeObjectStatusTest | |
| vmware.vcenter.alarm.vsan.health.test.iscsi.iscsihomeobjectstatustest | |
| vmware.vcenter.alarm.vsan.health.test.iscsi.iscsiInstallStatusTest | |
| vmware.vcenter.alarm.vsan.health.test.iscsi.iscsiServiceNetworkTest | |
| vmware.vcenter.alarm.vsan.health.test.iscsi.iscsiservicenetworktest | |
| vmware.vcenter.alarm.vsan.health.test.iscsi.iscsiServiceRunningTest | |
| vmware.vcenter.alarm.vsan.health.test.iscsi.iscsiservicerunningtest | |
| vmware.vcenter.alarm.vsan.health.test.limits | |
| vmware.vcenter.alarm.vsan.health.test.limits.limit0hf | |
| vmware.vcenter.alarm.vsan.health.test.limits.limit1hf | |
| vmware.vcenter.alarm.vsan.health.test.limits.nodecomponentlimit | |
| vmware.vcenter.alarm.vsan.health.test.network | |
| vmware.vcenter.alarm.vsan.health.test.network.clusterpartition | |
| vmware.vcenter.alarm.vsan.health.test.network.hostconnectivity | |
| vmware.vcenter.alarm.vsan.health.test.network.hostdisconnected | |
| vmware.vcenter.alarm.vsan.health.test.network.hostlatencycheck | |
| vmware.vcenter.alarm.vsan.health.test.network.largeping | |
| vmware.vcenter.alarm.vsan.health.test.network.matchingsubnet | |
| vmware.vcenter.alarm.vsan.health.test.network.multicastdeepdive | |
| vmware.vcenter.alarm.vsan.health.test.network.multicastsettings | |
| vmware.vcenter.alarm.vsan.health.test.network.multicastsuspected | |
| vmware.vcenter.alarm.vsan.health.test.network.smallping | |
| vmware.vcenter.alarm.vsan.health.test.network.unexpectedmember | |
| vmware.vcenter.alarm.vsan.health.test.network.vmotionpinglarge | |
| vmware.vcenter.alarm.vsan.health.test.network.vmotionpingsmall | |
| vmware.vcenter.alarm.vsan.health.test.network.vsanenabled | |
| vmware.vcenter.alarm.vsan.health.test.network.vsanvmknic | |
| vmware.vcenter.alarm.vsan.health.test.overallsummary | |
| vmware.vcenter.alarm.vsan.health.test.perfsvc | |
| vmware.vcenter.alarm.vsan.health.test.perfsvc.collection | |
| vmware.vcenter.alarm.vsan.health.test.perfsvc.hostsmissing | |
| vmware.vcenter.alarm.vsan.health.test.perfsvc.masterexist | |
| vmware.vcenter.alarm.vsan.health.test.perfsvc.perfsvcstatus | |
| vmware.vcenter.alarm.vsan.health.test.perfsvc.renameddirs | |
| vmware.vcenter.alarm.vsan.health.test.perfsvc.statsdb | |
| vmware.vcenter.alarm.vsan.health.test.perfsvc.verbosemode | |
| vmware.vcenter.alarm.vsan.health.test.physicaldisks | |
| vmware.vcenter.alarm.vsan.health.test.physicaldisks.componentmetadata | |
| vmware.vcenter.alarm.vsan.health.test.physicaldisks.lsomheap | |
| vmware.vcenter.alarm.vsan.health.test.physicaldisks.lsomslab | |
| vmware.vcenter.alarm.vsan.health.test.physicaldisks.physdiskcapacity | |
| vmware.vcenter.alarm.vsan.health.test.physicaldisks.physdiskcomplimithealth | |
| vmware.vcenter.alarm.vsan.health.test.physicaldisks.physdiskcongestion | |
| vmware.vcenter.alarm.vsan.health.test.physicaldisks.physdiskhostissues | |
| vmware.vcenter.alarm.vsan.health.test.physicaldisks.physdiskmetadata | |
| vmware.vcenter.alarm.vsan.health.test.physicaldisks.physdiskoverall | |
| vmware.vcenter.alarm.vsan.health.test.physicaldisks.physdisksoftware | |
| vmware.vcenter.alarm.vsan.health.test.stretchedcluster | |
| vmware.vcenter.alarm.vsan.health.test.stretchedcluster.clusterwithmultipleunicastagents | |
| vmware.vcenter.alarm.vsan.health.test.stretchedcluster.clusterwithoutonewitnesshost | |
| vmware.vcenter.alarm.vsan.health.test.stretchedcluster.clusterwithouttwodatafaultdomains | |
| vmware.vcenter.alarm.vsan.health.test.stretchedcluster.hostunicastagentunset | |
| vmware.vcenter.alarm.vsan.health.test.stretchedcluster.hostwithinvalidunicastagent | |
| vmware.vcenter.alarm.vsan.health.test.stretchedcluster.hostwithnostretchedclustersupport | |
| vmware.vcenter.alarm.vsan.health.test.stretchedcluster.siteconnectivity | |
| vmware.vcenter.alarm.vsan.health.test.stretchedcluster.witnessfaultdomaininvalid | |
| vmware.vcenter.alarm.vsan.health.test.stretchedcluster.witnessinsidevccluster | |
| vmware.vcenter.alarm.vsan.health.test.stretchedcluster.witnesspreferredfaultdomaininvalid | |
| vmware.vcenter.alarm.vsan.health.test.stretchedcluster.witnesspreferredfaultdomainnotexist | |
| vmware.vcenter.alarm.vsan.health.test.stretchedcluster.witnesswithnodiskmapping | |
| vmware.vcenter.alarm.vsan.health.test.vsanhardwarecert | |
| vmware.vcenter.alarm.vsan.health.test.vum vSAN health alarm | |
| vmware.vcenter.alarm.vsan.health.test.vum.vumconfig | |
| vmware.vcenter.alarm.vsan.health.test.vum.vumconfig | |
| vmware.vcenter.alarm.vsan.health.test.vum.vumrecommendation | |
| vmware.vcenter.alarm.VsanClusterLicenseExpiryAlarm | Monitors the expiry of the vSAN license and the end of the evaluation period. |
| vmware.vcenter.alarm.VsanHealthAlarm | |
| vmware.vcenter.alarm.VsanHostDiskErrorAlarm | Default alarm that monitors whether the host disks in the vSAN cluster have errors. |
| vmware.vcenter.alarm.VsanHostSsdOverUsageAlarm | Monitors whether the flash disk capacity on the host exceeds the limit of the vSAN license. |
| vmware.vcenter.alarm.VSMHealthAlarm | Monitors the health status of the vService Manager. |
| vmware.vcenter.alarm.VsphereAuthProxyHealthAlarm | |
| vmware.vcenter.alarm.VsphereClientHealthAlarm | Monitors vSphere Client Health. |
| vmware.vcenter.alarm.VsphereUiHealthAlarm | |
| vmware.vcenter.alarm.VwsHealthAlarm | Monitors the health status of the VMware System and Hardware Health Manager Service. |
| vmware.vcenter.alarm.count | Number of alarms on the device. |
VMware Events Monitoring
Create custom events
Navigate to Setup > Monitoring >Events.
Click +Add at the right top corner.
For Adapter Type, select VMware.
In the name field, enter EventId from vCenter Server 8.0 IA (Build 20519528) Events Events as the metric name.
Note: While creating the metric, it is required to replace “.” with “_“in the metric name.
Key Use Case
We have recently updated the VMware events and alarms to provide comprehensive details on how these alarms and events are generated. Below outlines the current design for events and alarms:
Retrieving alarms on individual resources
- If an alarm template is assigned on a Host, all alerts related to the Host are mapped accordingly.
- If an alarm template is assigned on a Datacenter, all alerts related to the Datacenter are mapped accordingly.
- If an alarm template is assigned on DataStores, all alerts related to DataStores are mapped accordingly.
- If an alarm template is assigned on VMs, all alerts related to VMs are mapped accordingly.
- To retrieve only vCenter-specific alarms:
- Assign the alarm template to the vCenter level and configure the parameter ‘vmware.vcenter.alarm.receive.child.alarms’ to ‘no’.
Configuration Parameters
| Configuration Parameters | Description |
|---|---|
| vmware.vcenter.event.policy | Any events added to the template and with the option set to "include" will be sent from the gateway to the cloud. All events in the end device will be triggered from the gateway to the cloud if this parameter is set to "all". |
| vmware.vcenter.event.include.severity.list | It indicates that such events, regardless of their severity, will be triggered from the gateway to the cloud. If they include "unknown,info,warning,error,user" events. Only these events are triggered 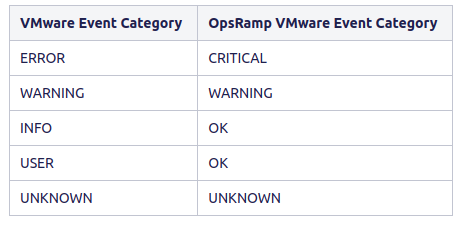 |
| vmware.vcenter.event.queue.type | Queue type has three categories.
|
| vmware.events.regex.match | When a regular expression is given as input to the "vmware.events.regex.match" pattern, the event will only be processed if its simple class name or class name or canonical class name matches the regular expression. Here, the "vmware.vcenter.event.policy" should be set to "all". Note: The default value of this parameter is set as "None". |
VMware Authentication Failure Notification
The following discovery and monitoring behaviours are applicable from versions 17.0.0 and later.
Discovery
When the discovery process fails, the system displays a failure message in the activity log and generates an authentication alert against the gateway device.
Monitoring
The OpsRamp tool sends an authentication failure alert with the metric name vmware.auth.error against the gateway resource. This alert triggers when monitoring stops due to connection issues, authentication failures, or other related issues.
Note
For versions prior to 17.0.0.
Discovery
Displaying a failure message in the activity when the discovery process fails.
Monitoring
The OpsRamp tool sends an authentication failure alert with the metric name vmware.auth.error specifically for VMware vCenter or ESXi hosts. This alert is triggered when monitoring is stopped due to issues related to connection, authentication failures, or other related issues.
The alert activates only when at least one of the following conditions is met:
- vCenter is discovered through integration, and the VMware vCenter Performance – v5 template is applied to the vCenter instance.
- ESXi is discovered through integration, and the VMware Host Performance – v6 template is applied to the ESXi host.
The system generates an alert when VMware discovery fails due to DNS name resolution issues. This capability is available starting from Gateway version 19.2.0.
Recommended Metrics for Availability
| Resource Type | Metric | Possible Values | Reference Link |
|---|---|---|---|
| HOST | VMware.host.status.availability | Possible values: connected - 1; disconnected / notResponding - 0. Reference: Enum - HostSystemConnectionState. | Enum - HostSystemConnectionState |
| DataStore | VMware.datastore.status.availability | Possible values: true - 1; false - 0. Reference: Data Object - DatastoreSummary. Note: Considering the "accessible" attribute for datastore status monitoring. | VData Object - DatastoreSummary Note: Considering the "accessible" attribute in the above URL for datastore status monitoring. |
| Cluster | VMware.cluster.status.availability | Possible values: Green / Yellow - 1; Red - 0. Reference: Managed Object - ManagedEntity. Note: Considering the "OverallStatus" attribute for cluster status monitoring. | Managed Object - ManagedEntityNote: Considering the "OverallStatus" attribute in the above URL for cluster status monitoring. |
| Virtual Machine | vmware.vm.power.state | Possible values: poweredOff (0), poweredOn (1), suspended (2). Reference: Enum - VirtualMachinePowerState. | Enum - VirtualMachinePowerState |
| VCenter | Apply vmware.vm.power.state on the virtual machine having the same IP address as VCenter | Possible values: poweredOff (0), poweredOn (1), suspended (2). Reference: Enum - VirtualMachinePowerState. | Enum - VirtualMachinePowerState |
Resource attributes
| Resource Type | attributes |
|---|---|
| vCenter | Resource name, OS, ipAddress, make, model, moId, vendor UUID |
| Datacenter | moId, make, model |
| Cluster | moId, make, model |
| Host | Resource name, OS, ipAddress, MAC address, make, model, moId, vendor UUID, serial number, CPU cores, Processor, NICs, Logical processors, vMotion feature, VMware EVC Mode, License Name, License Expiry Date, Connection state, Maintenance mode,Hardware info: RAM,Network Information: NICs info |
| Datastore | Resource name, moId, make, model |
| Virtual Machine | Resource name, DNS name, OS, make, model, IpAddress, MAC address, vendor UUID, vMotion feature, VMware EVC Mode, License Name, License Expiry Date, moId, Connection state, Guest state, VM tools version, vmware_pool, power state, moId,Hardware info : RAM, CPUs, Network adapters, OOB interface cards |
Resource Filtering
You can apply filter criteria using two tags RESOURCE and SMART. Each tag provides different methods for discovering resources based on defined conditions.
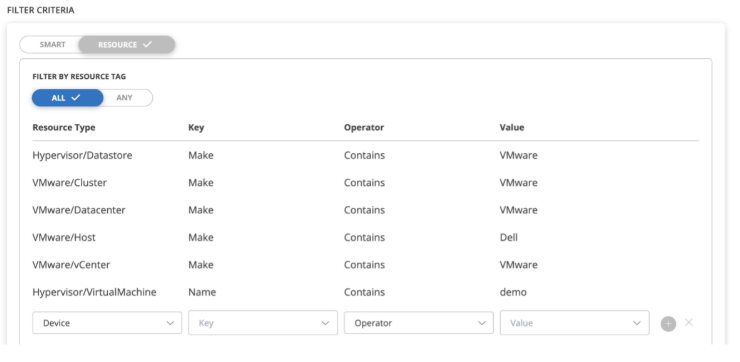
RESOURCE tagIf you select Resource tag as the filter type:
Filter by Resource Type displays two options:
- ALL: Discover all existing and future resources.
- ANY: Discover resources that match any of the defined conditions.
Enter/select the values in the Resource Type, Key, Operator, and Value fields for filtering the resources.
Click the plus symbol (+) to add filters.
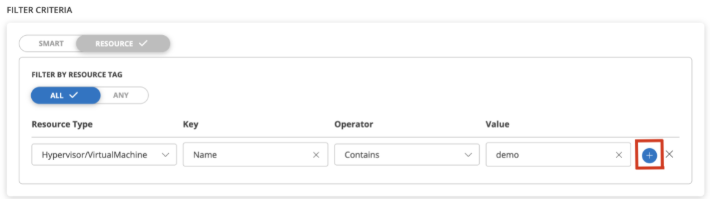
- To discover additional resource types alongside the filtered one, explicitly add filters for each type.Example: If filtering for virtual machines with names containing “demo,” only those virtual machines will be discovered. To include other types, define separate filters for each.
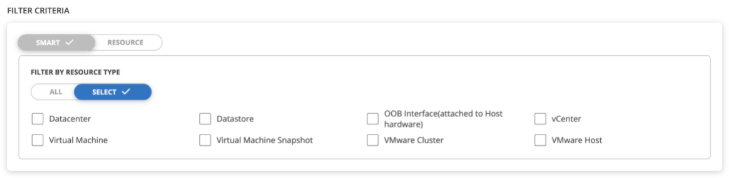
SMART tagIf you select Smart tag as the filter type:
- Filter by Resource Type displays two options:
- ALL: Discover all existing and future resources.
- SELECT: Choose one or more resource types to discover.
- Click ALL or SELECT to define the required resource type.
FAQs
- How is ESXi host ip address and hostname fetched?
If the host has an IP address, it is displayed in the ipAddress attribute. A reverse DNS lookup is then performed to resolve the hostname from this IP address, and the result is populated in the hostName attribute.
Alternatively, if the host has a hostname, it is displayed in the hostName attribute. A forward DNS lookup using InetAddress is then attempted to resolve the corresponding IP address. If successful, the resolved IP address is set in the ipAddress attribute. If the lookup fails, the hostname itself is set in the ipAddress attribute.
- Why is ‘%’ replaced with ‘00’ in alert description of vmware alarms?
Our tool retrieves alarms from vCenter through API. The alarm data, including the data in subject and description, is presented exactly as received from the vCenter—without any modification or transformation.
Percentage values in vCenter are stored as basis points, (where 1% equals 100 basis points). When the VMware alarm API returns these values, they are presented in their raw format. As a result, our tool reflects these values as-is
- Wrong IP is being shown in the attributes
- Check if there are any alternate discovery configured for the resource, and validate the IP address retrieved from it.-
- Retrieve the VMware inventory data from the gateway, and verify the IpAddress value listed for the resource.
Version History
Click here to view the Version History
| Gateway Version | Bug fixes / Enhancements |
|---|---|
| 21.0.0 |
|
| 20.1.0 |
|
| 19.1.0 | Added VM Tools version attribute support for VMware virtual machines. Added metric support for Added support for CPU hardware information - Processor Name, Max Clock Speed, and Number of Cores for VMware virtual machines. Added support to create custom VMware events and alarms that contain special characters such as (-, @, $, #, &, %) in the event or alarm name. For example, for an alarm like VM-HIGH-CPU-1HR, we need to create the alarm metric in OpsRamp as For an event like VM-HIGH-MEMORY-1HR, we need to create the event metric in OpsRamp as Added fix to generate authentication failure alert against gateway in all failure cases during monitoring, which were not covered earlier. |
| 19.0.0 | Added support for the vmware_vm_cpu_count and vmware_host_cpucores_count VMware metrics. |
| 18.2.0 | Enhanced VMware vSAN monitoring performance. Added support for new VMware metrics: |
| 18.1.0 | Added support for "Connection State" and "Guest State" custom attributes to virtual machines for VMware Classic APP. Fixed the issue of not creating a new session when the customer updates the port in the credentials. |
| 18.0.0 | Added monitoring support to VMware Host IO Read, IO Write, and latency metrics. Added fix to VMware vSAN discovery response parsing issue. |
| 17.1.0 | Improved VMware authentication failure alert mechanism. Fixed VMware performance metric issue. Added a fix to ensure proper functionality when adding a new performance metric to an existing VMware template. |
| 16.2.0 | Added fix to ensure VMware Hardware template compatibility with Java 17. Resolved vCenter appliance monitoring connection issue. Added Events and TransferStatus metric monitoring support for VMware RP4VMs. |
| 15.1.0 | VMware Monitoring Enhancement Added monitoring support for VMware vSAN 8 version. |
| 15.0.0 | VMware Monitoring Enhancement |
| 14.0.0 | Resource Pool Information on VMs VMware monitoring Enhancement vCenter Events Based Inventory/Discovery |